
- Trending Categories
 Data Structure
 Networking
 RDBMS
RDBMS Operating System
 Java
Java MS Excel
 iOS
iOS HTML
HTML CSS
CSS Android
 Python
 C Programming
 C++
C++ C#
C# MongoDB
 MySQL
MySQL Javascript
 PHP
PHP Physics
 Chemistry
 Biology
 Mathematics
 English
 Economics
 Psychology
 Social Studies
 Fashion Studies
 Legal Studies
- Selected Reading
- UPSC IAS Exams Notes
- Developer's Best Practices
- Questions and Answers
- Effective Resume Writing
- HR Interview Questions
- Computer Glossary
- Who is Who
Annotate bars with values on Pandas bar plots in Python
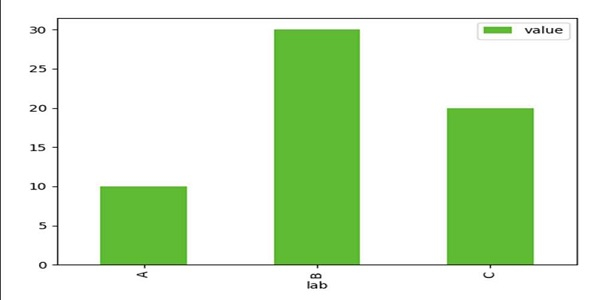
In this program, we can create a data frame and can plot a bar using df.plot.bar(x='lab', y='value', color='#5fba34') plot.
Steps
Using Panda’s dataframe, we can create a data frame with the given dictionary, where the keys are lab and value, values of these keys are lists, respectively.
Using Pandas plot.bar() method, we can create a vertical bar plot. A bar plot is a plot that presents categorical data with rectangular bars with lengths proportional to the values that they represent.
To show the figure, use the plt.show() method.
Example
import pandas as pd

from matplotlib import pyplot as plt
df = pd.DataFrame({'lab': ['A', 'B', 'C'], 'value': [10, 30, 20]})
ax = df.plot.bar(x='lab', y='value', color='#5fba34')
plt.show()
Output

Updated on: 2021-03-15T08:39:08+05:30
496 Views

Advertisements