
- Trending Categories
 Data Structure
 Networking
 RDBMS
RDBMS Operating System
 Java
Java MS Excel
 iOS
iOS HTML
HTML CSS
CSS Android
 Python
 C Programming
 C++
C++ C#
C# MongoDB
 MySQL
MySQL Javascript
 PHP
PHP Physics
 Chemistry
 Biology
 Mathematics
 English
 Economics
 Psychology
 Social Studies
 Fashion Studies
 Legal Studies
- Selected Reading
- UPSC IAS Exams Notes
- Developer's Best Practices
- Questions and Answers
- Effective Resume Writing
- HR Interview Questions
- Computer Glossary
- Who is Who
Change the outline color for histogram bars using ggplot2 in R.
To change the outlines color of histogram bars using ggplot2, we can use col argument inside geom_histogram function of ggplot2 package.
For Example, if we have a data frame called df that contains a column say X then we can create the histogram of X with different outline color of bars using the below command −
ggplot(df,aes(X))+geom_histogram(bins=30,col=I("red"))
Example
Following snippet creates a sample data frame −
x<-rnorm(20000)
df<-data.frame(x)
head(df,20)
The following dataframe is created −
          x
 1 -1.31426410
 2 -2.62316895
 3 -0.19231545
 4  0.89701476
 5 -0.10409584
 6  0.23481007
 7  1.53117888
 8 -0.63855632
 9  0.85309492
10  0.04791316
11  0.37854603
12  1.24928336
13 -0.65170883
14  2.58938742
15 -0.82602063
16  0.97524621
17  0.36930032
18  0.07720108
19 -0.66050878
20  0.66199644
To load the ggplot2 package and to create a histogram of x, on the above created data frame, add the following code to the above snippet −
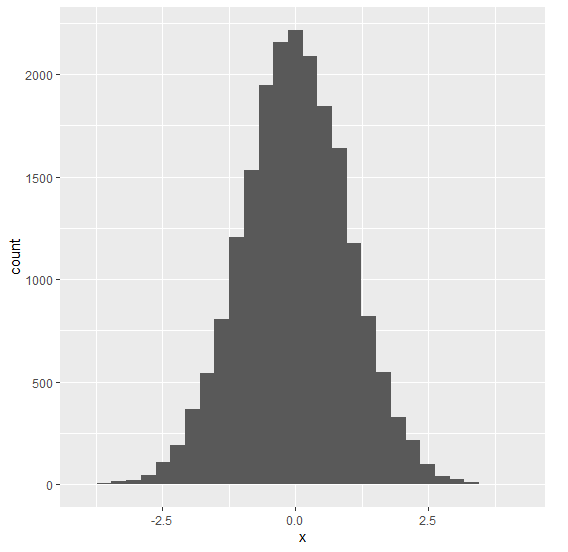
x<-rnorm(20000)

library(ggplot2)
ggplot(df,aes(x))+geom_histogram(bins=30)
Output
If you execute all the above given snippets as a single program, it generates the following Output −
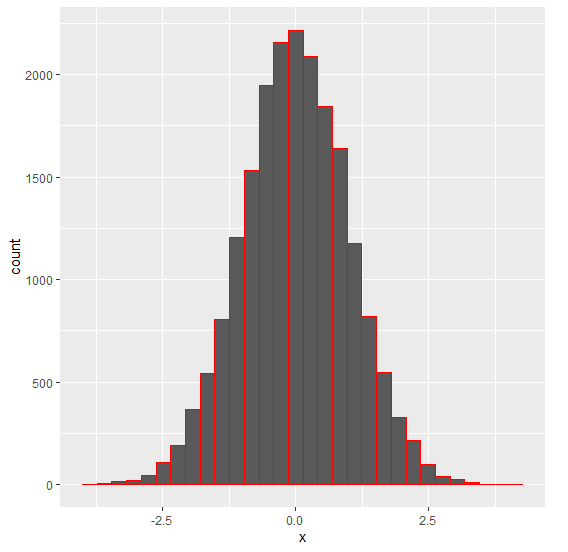
To create a histogram of x with red colored outline of bars, on the above created data frame, add the following code to the above snippet −
x<-rnorm(20000)

library(ggplot2)
ggplot(df,aes(x))+geom_histogram(bins=30,col=I("red"))
Output
If you execute all the above given snippets as a single program, it generates the following Output −

4K+ Views
