
- Trending Categories
 Data Structure
 Networking
 RDBMS
RDBMS Operating System
 Java
Java MS Excel
 iOS
iOS HTML
HTML CSS
CSS Android
 Python
 C Programming
 C++
C++ C#
C# MongoDB
 MySQL
MySQL Javascript
 PHP
PHP Physics
 Chemistry
 Biology
 Mathematics
 English
 Economics
 Psychology
 Social Studies
 Fashion Studies
 Legal Studies
- Selected Reading
- UPSC IAS Exams Notes
- Developer's Best Practices
- Questions and Answers
- Effective Resume Writing
- HR Interview Questions
- Computer Glossary
- Who is Who
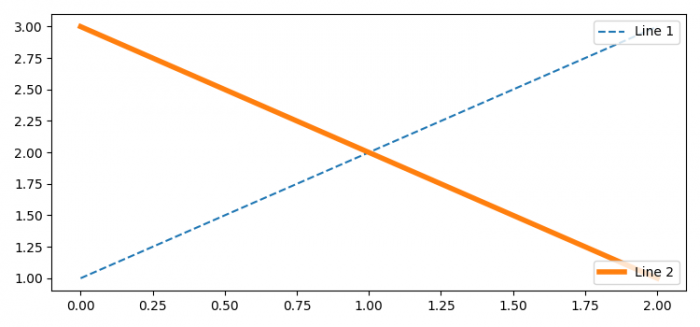
Drawing multiple legends on the same axes in Matplotlib
To draw multiple legends on the same axes in Matplotlib, we can take the following steps −
- Set the figure size and adjust the padding between and around the subplots
- Plot lines using two lists with different labels, linewidth and linestyle.
- Place the first legend at the upper-right location.
- Add artist, i.e., first legend on the current axis.
- Place the second legend on the current axis at the lower-right location.
- To display the figure, use show() method.
Example
from matplotlib import pyplot as plt

plt.rcParams["figure.figsize"] = [7.50, 3.50]
plt.rcParams["figure.autolayout"] = True

line1, = plt.plot([1, 2, 3], label="Line 1", linestyle='--')
line2, = plt.plot([3, 2, 1], label="Line 2", linewidth=4)

first_legend = plt.legend(handles=[line1], loc='upper right')

plt.gca().add_artist(first_legend)
plt.legend(handles=[line2], loc='lower right')

plt.show()
Output

Updated on: 2021-06-03T10:13:58+05:30
10K+ Views

Advertisements