
- Trending Categories
 Data Structure
 Networking
 RDBMS
RDBMS Operating System
 Java
Java MS Excel
 iOS
iOS HTML
HTML CSS
CSS Android
 Python
 C Programming
 C++
C++ C#
C# MongoDB
 MySQL
MySQL Javascript
 PHP
PHP Physics
 Chemistry
 Biology
 Mathematics
 English
 Economics
 Psychology
 Social Studies
 Fashion Studies
 Legal Studies
- Selected Reading
- UPSC IAS Exams Notes
- Developer's Best Practices
- Questions and Answers
- Effective Resume Writing
- HR Interview Questions
- Computer Glossary
- Who is Who
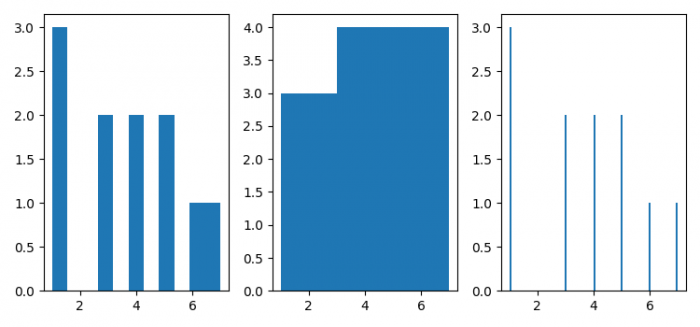
How is the Pyplot histogram bins interpreted? (Matplotlib)
To plot histogram bins interpreted with different bins, we can take the following steps −
Set the figure size and adjust the padding between and around the subplots.
Make a list of data to plot in histogram.
Add a subplot to the current figure,nrows=1, ncols=3 and index=1.
Plot a histogram with data; bins is a number.
Add a subplot to the current figure, nrows=1, ncols=3 and index=2.
Plot a histogram with data; bins is an array.
Add a subplot to the current figure, nrows=1, ncols=3 and index=3.
Plot a histogram with data, bins is a string.
Example
import matplotlib.pyplot as plt

plt.rcParams["figure.figsize"] = [7.50, 3.50]
plt.rcParams["figure.autolayout"] = True

data = [1, 3, 1, 4, 7, 1, 3, 5, 4, 6, 5]

plt.subplot(131)
plt.hist(data, bins=len(data))

plt.subplot(132)
plt.hist(data, bins=[1, 3, 5, 7])

plt.subplot(133)
plt.hist(data, bins='stone')

plt.show()
Output

Updated on: 2021-08-09T06:47:47+05:30
295 Views

Advertisements