
- Trending Categories
 Data Structure
 Networking
 RDBMS
RDBMS Operating System
 Java
Java MS Excel
 iOS
iOS HTML
HTML CSS
CSS Android
 Python
 C Programming
 C++
C++ C#
C# MongoDB
 MySQL
MySQL Javascript
 PHP
PHP Physics
 Chemistry
 Biology
 Mathematics
 English
 Economics
 Psychology
 Social Studies
 Fashion Studies
 Legal Studies
- Selected Reading
- UPSC IAS Exams Notes
- Developer's Best Practices
- Questions and Answers
- Effective Resume Writing
- HR Interview Questions
- Computer Glossary
- Who is Who
How to build colorbars without attached plot in matplotlib?
To build colorbars without attached plot in matplotlib, we can take the following steps.
Steps
Set the figure size and adjust the padding between and around the subplots.
Create a figure and a set of subplots.
Adjust the subplot layout parameters.
Normalize the quaternion in place. Return the norm of the quaternion.
Get the colorbar instance (cb) with base colorbar and horizontal orientation.
To display the figure, use Show() method.
Example
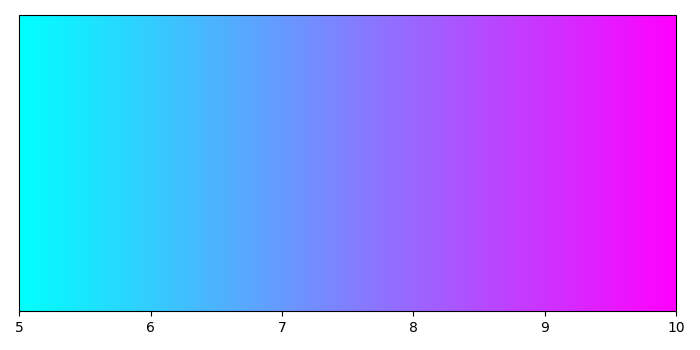
import matplotlib.pyplot as plt
import matplotlib as mpl

# Set the figure size
plt.rcParams["figure.figsize"] = [7.00, 3.50]
plt.rcParams["figure.autolayout"] = True

# Create a figure and a set of subplots
fig, ax = plt.subplots()

# Adjust the subplot layout parameter
fig.subplots_adjust(bottom=0.5)

# Normalize
norm = mpl.colors.Normalize(vmin=5, vmax=10)

# Get the colorbar instance
cb = mpl.colorbar.ColorbarBase(ax, cmap=mpl.cm.cool, norm=norm, orientation='horizontal')

# Display the plot
plt.show()
Output
It will produce the following output −

Updated on: 2021-10-19T08:07:18+05:30
214 Views

Advertisements