
- Trending Categories
 Data Structure
 Networking
 RDBMS
RDBMS Operating System
 Java
Java MS Excel
 iOS
iOS HTML
HTML CSS
CSS Android
 Python
 C Programming
 C++
C++ C#
C# MongoDB
 MySQL
MySQL Javascript
 PHP
PHP Physics
 Chemistry
 Biology
 Mathematics
 English
 Economics
 Psychology
 Social Studies
 Fashion Studies
 Legal Studies
- Selected Reading
- UPSC IAS Exams Notes
- Developer's Best Practices
- Questions and Answers
- Effective Resume Writing
- HR Interview Questions
- Computer Glossary
- Who is Who
How to change the default type of points for scatterplot using ggplot2 in R?
To change the defaults for ggplot2 geoms, we need to use update_geom_defaults function. If we want to change the shape of points for scatterplot, we can use the below syntax −
update_geom_defaults("point",list(shape=”point_shape_number”))
The point shape number ranges from 0 to 25. We can change that according to our need.
Consider the below data frame −
Example
x<-rnorm(20)
y<-rnorm(20,5,0.32)
df<-data.frame(x,y)
df
Output
        x           y
1  -0.005184157  5.338089
2  -1.044878945  4.662460
3  1.154191529   5.450373
4  -0.437975797  4.649176
5  -0.220793320  5.057522
6  -0.062619288  5.003642
7  -1.023676613  4.949002
8  0.902098608   4.632925
9  -0.259247125  4.792074
10 0.305164402   5.745798
11 -0.891792853  4.458326
12 -0.451765777  4.435208
13 -0.018278677  5.525500
14 0.917192389   4.740232
15 -1.366201294  5.363222
16 -0.491698757  5.305723
17 0.680064934   5.406010
18 -1.058529703  5.084462
19 1.862063812   4.851102
20 0.433153374   4.346126
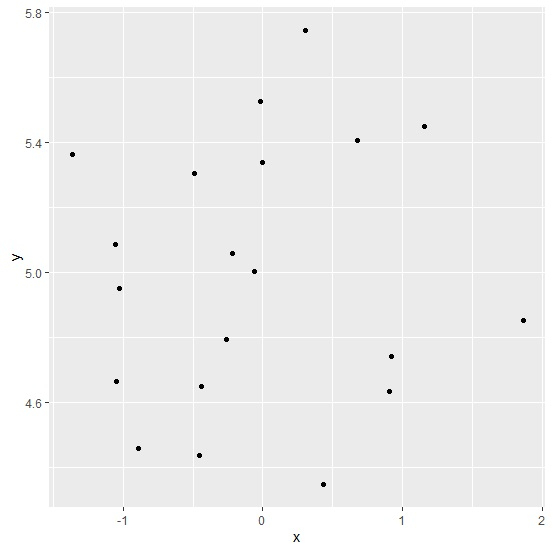
Loading ggplot2 package and creating a scatterplot between x and y −
Example
library(ggplot2)
ggplot(df,aes(x,y))+geom_point()
Output
Updating point type for scatterplot of ggplot2 package and creating the plot −
Example
update_geom_defaults("point",list(shape=6))
ggplot(df,aes(x,y))+geom_point()
Output


Updated on: 2021-02-08T06:35:49+05:30
260 Views

Advertisements