
- Trending Categories
 Data Structure
 Networking
 RDBMS
RDBMS Operating System
 Java
Java MS Excel
 iOS
iOS HTML
HTML CSS
CSS Android
 Python
 C Programming
 C++
C++ C#
C# MongoDB
 MySQL
MySQL Javascript
 PHP
PHP Physics
 Chemistry
 Biology
 Mathematics
 English
 Economics
 Psychology
 Social Studies
 Fashion Studies
 Legal Studies
- Selected Reading
- UPSC IAS Exams Notes
- Developer's Best Practices
- Questions and Answers
- Effective Resume Writing
- HR Interview Questions
- Computer Glossary
- Who is Who
How to create an exponential distribution plot in R?
To create an exponential distribution plot, we can use curve function.
For example, if we want to create a exponential distribution plot for 100 values with rate parameter equal to ½ then we can use the command given below:
curve(dexp(x,rate=1/2),xlim=c(1,50))
Check out the below examples to understand how it works.
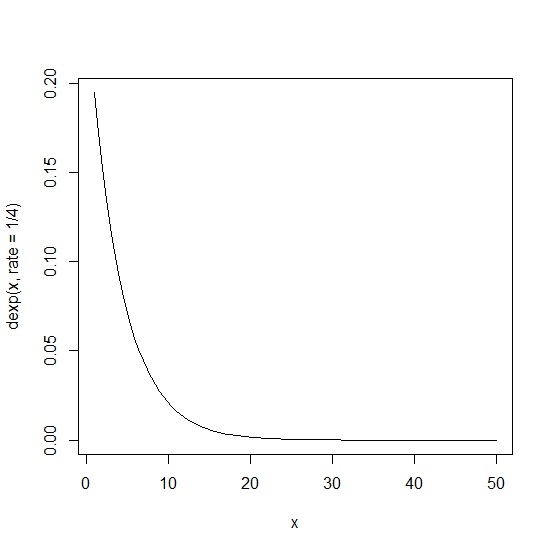
Example 1
To create an exponential distribution plot, use the command given below −
curve(dexp(x,rate=1/4),xlim=c(1,50))
Output
If you execute all the above given snippets as a single program, it generates the following output: −
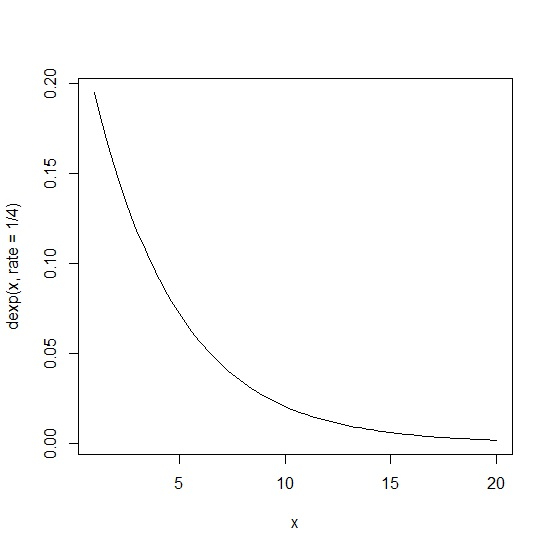
Example 2
To create an exponential distribution plot, use the command given below −
curve(dexp(x,rate=1/4),xlim=c(1,20))
Output
If you execute all the above given snippets as a single program, it generates the following output: −

Updated on: 2021-11-10T13:15:24+05:30
838 Views

Advertisements