
- Trending Categories
 Data Structure
 Networking
 RDBMS
RDBMS Operating System
 Java
Java MS Excel
 iOS
iOS HTML
HTML CSS
CSS Android
 Python
 C Programming
 C++
C++ C#
C# MongoDB
 MySQL
MySQL Javascript
 PHP
PHP Physics
 Chemistry
 Biology
 Mathematics
 English
 Economics
 Psychology
 Social Studies
 Fashion Studies
 Legal Studies
- Selected Reading
- UPSC IAS Exams Notes
- Developer's Best Practices
- Questions and Answers
- Effective Resume Writing
- HR Interview Questions
- Computer Glossary
- Who is Who
How to create boxplot of vectors having different lengths in R?
If we have multiple vectors of different lengths then the boxplot for such vectors can be created by creating a single data frame using those vectors with a categorical column showing the name of the vectors and a numerical column having the corresponding values. Then boxplot function will be used as shown in the below example.
Example
Consider the below vector x and y and create the data frame using them −
> x<-rpois(20,2)
> y<-rpois(15,2)
> df<-data.frame(X=c(x,y),Grp=rep(c("x","y"),times=c(20,15)))
> df
Output
   X Grp
1  4   x
2  2   x
3  1   x
4  2   x
5  0   x
6  2   x
7  3   x
8  1   x
9  0   x
10 1   x
11 3   x
12 4   x
13 2   x
14 3   x
15 4   x
16 1   x
17 1   x
18 1   x
19 1   x
20 1   x
21 1   y
22 0   y
23 1   y
24 4   y
25 1   y
26 1   y
27 2   y
28 3   y
29 1   y
30 5   y
31 2   y
32 0   y
33 1   y
34 4   y
35 1   y
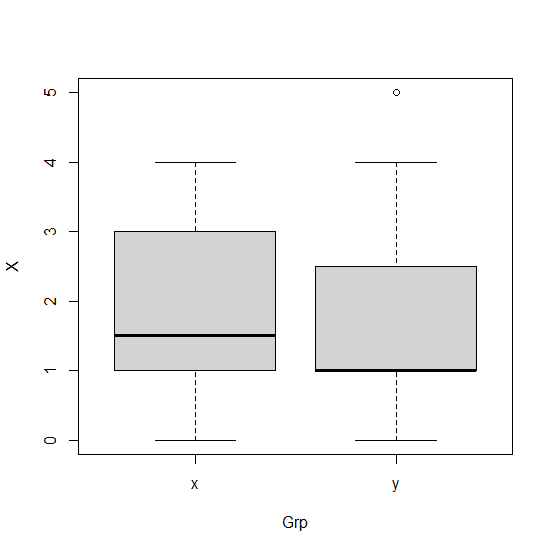
Creating the boxplot for groups in df −
> boxplot(X~Grp,data=df)
Output

Updated on: 2021-03-05T06:31:19+05:30
2K+ Views

Advertisements