
- Trending Categories
 Data Structure
 Networking
 RDBMS
RDBMS Operating System
 Java
Java MS Excel
 iOS
iOS HTML
HTML CSS
CSS Android
 Python
 C Programming
 C++
C++ C#
C# MongoDB
 MySQL
MySQL Javascript
 PHP
PHP Physics
 Chemistry
 Biology
 Mathematics
 English
 Economics
 Psychology
 Social Studies
 Fashion Studies
 Legal Studies
- Selected Reading
- UPSC IAS Exams Notes
- Developer's Best Practices
- Questions and Answers
- Effective Resume Writing
- HR Interview Questions
- Computer Glossary
- Who is Who
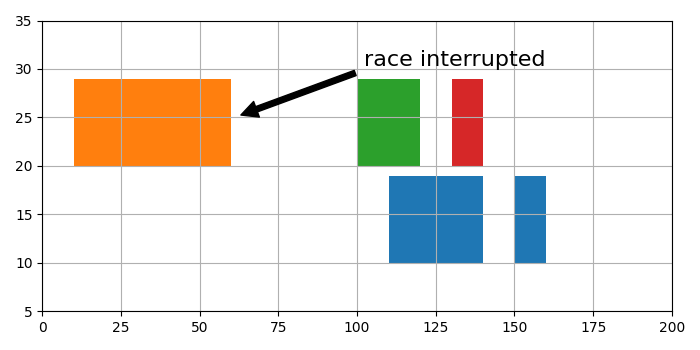
How to create broken horizontal bar graphs in matplotlib?
To create broken horizontal bar graphs in matplotlib, we can take the following steps −
- Set the figure size and adjust the padding between and around the subplots.
- Create a figure and a set of subplots.
- Plot a horizontal sequence of rectangles.
- Scale X and Y axes limit.
- Configure the grid lines.
- Annotate the broken bars.
- To display the figure, use show() method.
Example
import matplotlib.pyplot as plt

plt.rcParams["figure.figsize"] = [7.00, 3.50]
plt.rcParams["figure.autolayout"] = True

fig, ax = plt.subplots()

# Horizontal sequence of rectangles
ax.broken_barh([(110, 30), (150, 10)], (10, 9), facecolors='tab:blue')
ax.broken_barh([(10, 50), (100, 20), (130, 10)], (20, 9),
   facecolors=('tab:orange', 'tab:green', 'tab:red'))

# Scale X and Y axes limits
ax.set_ylim(5, 35)
ax.set_xlim(0, 200)

# Configure the grid lines
ax.grid(True)

# Annotate the broken bars
ax.annotate('race interrupted', (61, 25),
   xytext=(0.8, 0.9), textcoords='axes fraction',
   arrowprops=dict(facecolor='black', shrink=0.05),
   fontsize=16,
   horizontalalignment='right', verticalalignment='top')

plt.show()
Output
It will produce the following output


Updated on: 2021-09-22T08:52:51+05:30
300 Views

Advertisements