
- Trending Categories
 Data Structure
 Networking
 RDBMS
RDBMS Operating System
 Java
Java MS Excel
 iOS
iOS HTML
HTML CSS
CSS Android
 Python
 C Programming
 C++
C++ C#
C# MongoDB
 MySQL
MySQL Javascript
 PHP
PHP Physics
 Chemistry
 Biology
 Mathematics
 English
 Economics
 Psychology
 Social Studies
 Fashion Studies
 Legal Studies
- Selected Reading
- UPSC IAS Exams Notes
- Developer's Best Practices
- Questions and Answers
- Effective Resume Writing
- HR Interview Questions
- Computer Glossary
- Who is Who
How to create facets in vertical order using ggplot2 in R?
To create facets in vertical order using ggplot2 in R, we can follow the below steps −
- First of all, create a data frame.
- Then, create facetted plot with facet_grid function.
- After that, create the facetted plot with facet_wrap function.
Create the data frame
Let's create a data frame as shown below −
x<-rnorm(20)
y<-rnorm(20)
Grp<-sample(LETTERS[1:3],20,replace=TRUE)
df<-data.frame(x,y,Grp)
df
On executing, the above script generates the below output(this output will vary on your system due to randomization) −
        x           y   Grp
1 0.94991539 -1.0542462  A
2 -0.57885618 -2.0540170 A
3 -1.23460243 0.8274220  A
4 -0.21877000 -1.9415441 C
5 0.04090913 1.6289717   B
6 -0.64176648 -0.3619278 B
7 -0.96150947 -0.6270708 B
8 0.67482657 -0.9131730  A
9 -0.91607782 -1.6654625 C
10 0.28532388 0.4168112  B
11 0.35770097 -1.7113561 C
12 1.11407808 0.3201749  C
13 -0.01130312 -1.0384266 A
14 -2.02079485 0.5223646 B
15 0.61790518 0.7451400  C
16 -0.11281998 0.2334734 B
17 1.59511515 -2.0538179 C
18 0.54389377 -1.4884317 C
19 -1.65685694 2.1253106 B
20 0.10209988 1.6262022  B
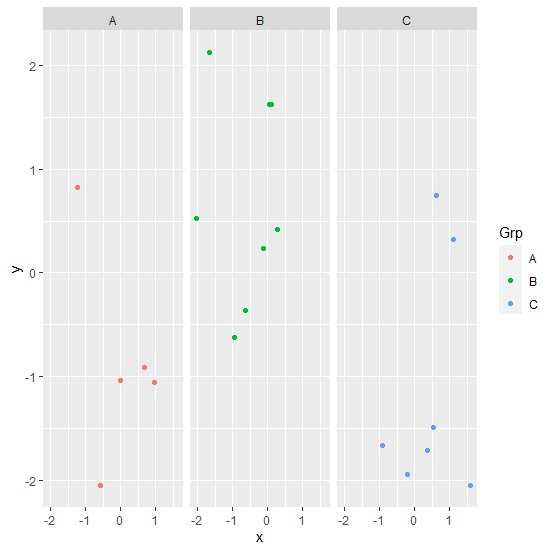
Create the facetted plot with facet_grid
Using facet_grid function to create the facetted scatterplots between x and y based on Grp column −
x<-rnorm(20)
y<-rnorm(20)
Grp<-sample(LETTERS[1:3],20,replace=TRUE)
df<-data.frame(x,y,Grp)
library(ggplot2)
ggplot(df,aes(x,y,col=Grp))+geom_point()+facet_grid(~Grp)
Output
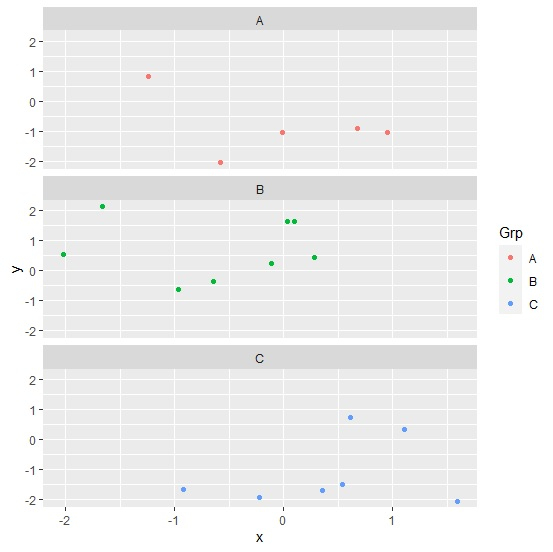
Create the facetted plot with facet_wrap
Using facet_wrap function to create the facetted scatterplots between x and y based on Grp column −
x<-rnorm(20)
y<-rnorm(20)
Grp<-sample(LETTERS[1:3],20,replace=TRUE)
df<-data.frame(x,y,Grp)
library(ggplot2)
ggplot(df,aes(x,y,col=Grp))+geom_point()+facet_wrap(~Grp,ncol=1)
Output

Updated on: 2021-08-14T07:50:55+05:30
4K+ Views

Advertisements