
- Trending Categories
 Data Structure
 Networking
 RDBMS
RDBMS Operating System
 Java
Java MS Excel
 iOS
iOS HTML
HTML CSS
CSS Android
 Python
 C Programming
 C++
C++ C#
C# MongoDB
 MySQL
MySQL Javascript
 PHP
PHP Physics
 Chemistry
 Biology
 Mathematics
 English
 Economics
 Psychology
 Social Studies
 Fashion Studies
 Legal Studies
- Selected Reading
- UPSC IAS Exams Notes
- Developer's Best Practices
- Questions and Answers
- Effective Resume Writing
- HR Interview Questions
- Computer Glossary
- Who is Who
How to create histogram with relative frequency in R?
The relative frequency histogram can be created for the column of an R data frame or a vector that contains discrete data. For this purpose, we can use PlotRelativeFrequency function of HistogramTools package along with hist function to generate histogram. For example, if we have a vector x for which we want to create a histogram with relative frequencies then it can be done as PlotRelativeFrequency(hist(x)).
Example
Consider the below vector −
x<-sample(1:5,20,replace=TRUE)
x
Output
[1] 2 1 1 4 3 5 5 4 1 3 5 1 4 1 3 4 4 1 1 1
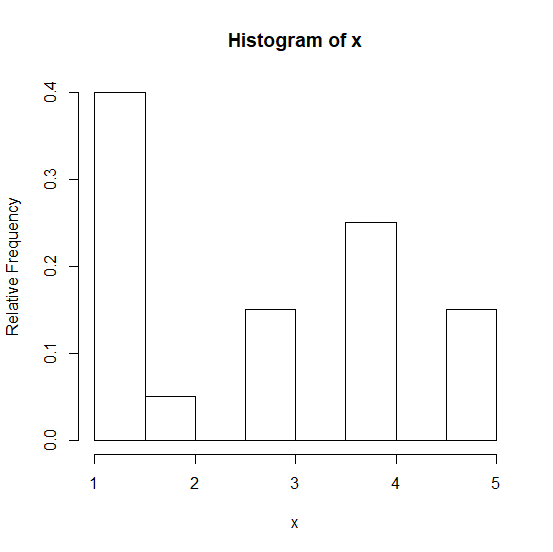
Loading HistogramTools package and creating histogram of x with relative frequency −
Example
library("HistogramTools")
PlotRelativeFrequency(hist(x))
Output
Example
y<-sample(1:10,100,replace=TRUE)
y
Output
[1] 7 6 8 9 5 1 2 9 6 7 2 1 3 3 6 7 7 4 9 5 10 5 10 6 6
[26] 4 10 9 5 1 9 7 9 9 2 7 8 8 10 10 8 5 9 8 3 6 9 8 9 10
[51] 6 6 6 4 8 8 6 10 2 7 6 5 1 8 7 9 2 6 2 9 2 5 8 3 2
[76] 3 2 4 5 9 5 5 9 4 2 6 3 10 3 2 7 9 4 8 10 6 5 8 8 2
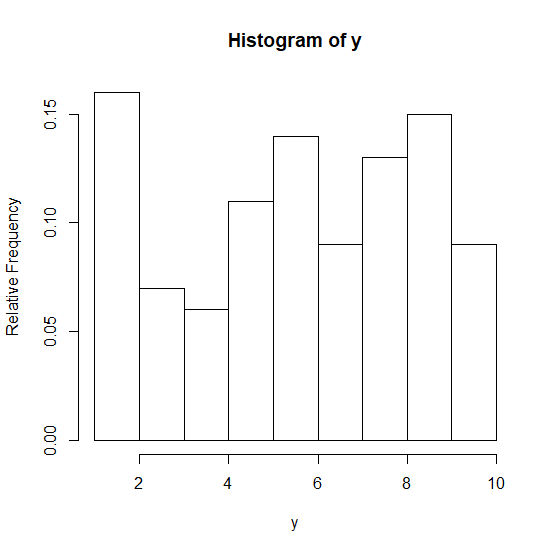
Example
PlotRelativeFrequency(hist(y))
Output

Updated on: 2020-10-17T09:46:49+05:30
2K+ Views

Advertisements