
- Trending Categories
 Data Structure
 Networking
 RDBMS
RDBMS Operating System
 Java
Java MS Excel
 iOS
iOS HTML
HTML CSS
CSS Android
 Python
 C Programming
 C++
C++ C#
C# MongoDB
 MySQL
MySQL Javascript
 PHP
PHP Physics
 Chemistry
 Biology
 Mathematics
 English
 Economics
 Psychology
 Social Studies
 Fashion Studies
 Legal Studies
- Selected Reading
- UPSC IAS Exams Notes
- Developer's Best Practices
- Questions and Answers
- Effective Resume Writing
- HR Interview Questions
- Computer Glossary
- Who is Who
How to create normal probability plot in R with confidence interval bands?
To create normal probability plot in R with confidence interval bands, we can use qqPlot function of QTLRel package. We simply need to pass the vector name that contains normal distribution values inside qqPlot function or directly introduce the vector inside the function as shown in the below given examples.
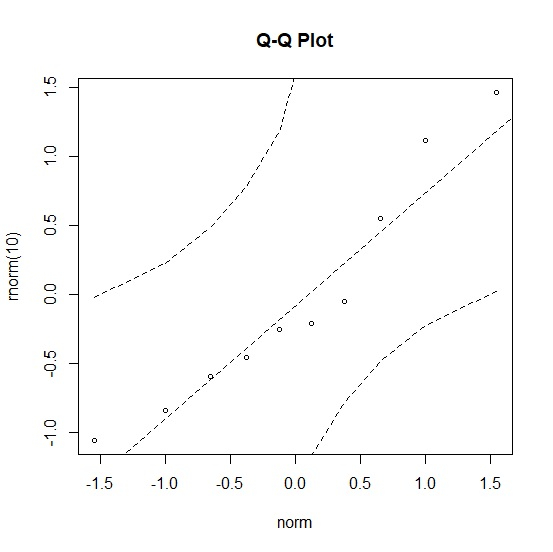
Example 1
Use the following code to create normal probability plot −
library("QTLRel")
qqPlot(rnorm(10))
Output
If you execute the above given snippet, it generates the following Output −
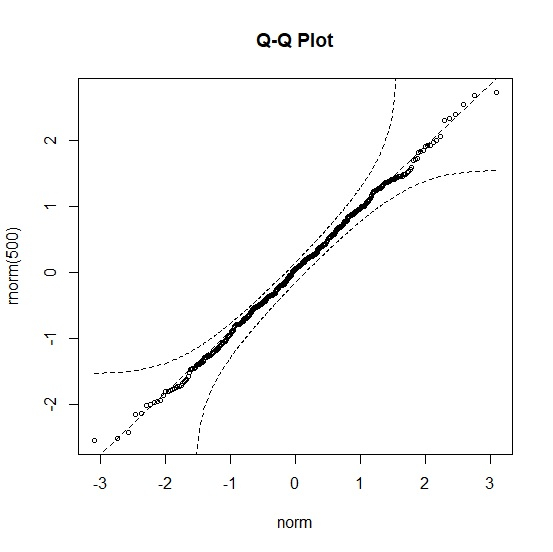
Example 2
Add the following code to the above snippet to create normal probability plot −
qqPlot(rnorm(500))
Output
If you execute the above given snippet, it generates the following Output −
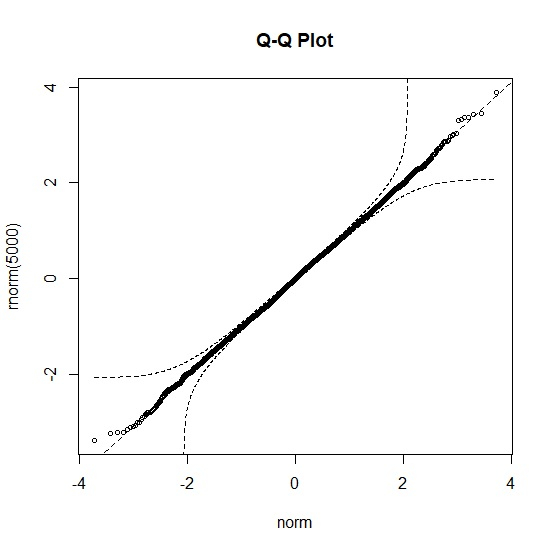
Example 3
Add the following code to the above snippet to create normal probability plot −
qqPlot(rnorm(5000))
Output
If you execute the above given snippet, it generates the following Output −

2K+ Views
