
- Trending Categories
 Data Structure
 Networking
 RDBMS
RDBMS Operating System
 Java
Java MS Excel
 iOS
iOS HTML
HTML CSS
CSS Android
 Python
 C Programming
 C++
C++ C#
C# MongoDB
 MySQL
MySQL Javascript
 PHP
PHP Physics
 Chemistry
 Biology
 Mathematics
 English
 Economics
 Psychology
 Social Studies
 Fashion Studies
 Legal Studies
- Selected Reading
- UPSC IAS Exams Notes
- Developer's Best Practices
- Questions and Answers
- Effective Resume Writing
- HR Interview Questions
- Computer Glossary
- Who is Who
How to create stacked barplot using barplot function with each bar having unique color in R?
In a bar plot, each bar represents one category of a single categorical variable but in a stacked bar plot, the bars represent same categorical variable but each divided into sub-categories. If we want to have similar distribution of colors in each bar then col argument with barplot function can be used.
Example1
M1<−matrix(sample(c(1:5),20,replace=TRUE),ncol=4)
M1
Output
   [,1] [,2] [,3] [,4]
[1,] 4    3    5    3
[2,] 4    2    1    4
[3,] 5    5    2    3
[4,] 3    2    2    4
[5,] 1    5    2    5
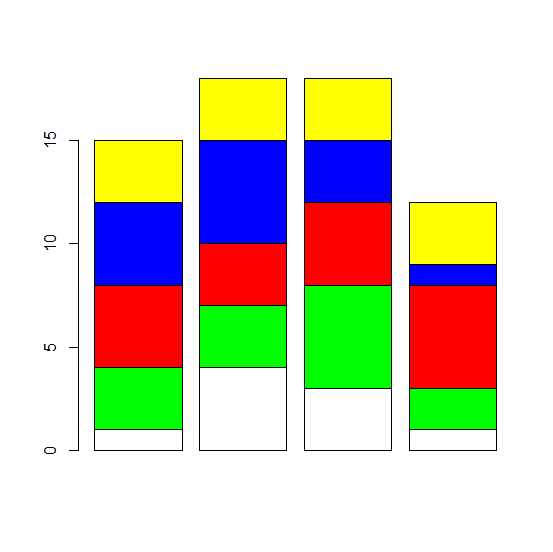
Example
barplot(M1,col=rep(c("white","green","red","blue","yellow"),5))
Output
Example2
M2<−matrix(sample(c(26:30),20,replace=TRUE),ncol=4)
M2
[,1] [,2] [,3] [,4]
[1,] 28 27 27 29
[2,] 30 28 28 27
[3,] 28 28 30 29
[4,] 30 28 28 28
[5,] 26 28 29 30
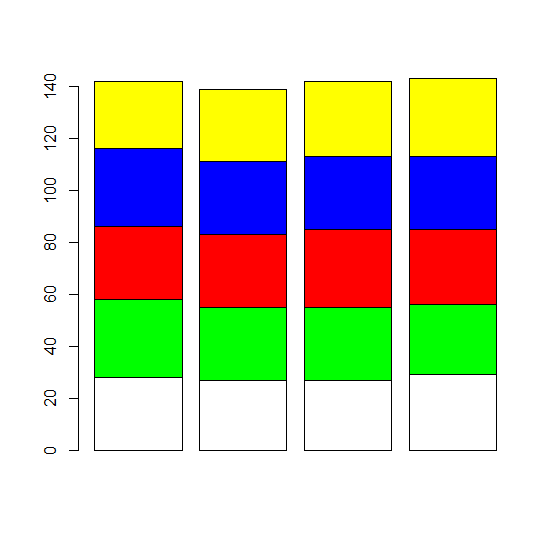
Example
barplot(M2,col=rep(c("white","green","red","blue","yellow"),5))
Output
Example
M3<−matrix(rpois(20,5),ncol=4)
M3
Output
[,1] [,2] [,3] [,4]
[1,] 6 8 4 5
[2,] 8 3 7 2
[3,] 5 4 4 2
[4,] 5 3 5 2
[5,] 6 5 2 3
Example
barplot(M3,col=rep(c("white","green","red","blue","yellow"),5))
Output

Updated on: 2020-11-07T11:38:35+05:30
387 Views

Advertisements