
- Trending Categories
 Data Structure
 Networking
 RDBMS
RDBMS Operating System
 Java
Java MS Excel
 iOS
iOS HTML
HTML CSS
CSS Android
 Python
 C Programming
 C++
C++ C#
C# MongoDB
 MySQL
MySQL Javascript
 PHP
PHP Physics
 Chemistry
 Biology
 Mathematics
 English
 Economics
 Psychology
 Social Studies
 Fashion Studies
 Legal Studies
- Selected Reading
- UPSC IAS Exams Notes
- Developer's Best Practices
- Questions and Answers
- Effective Resume Writing
- HR Interview Questions
- Computer Glossary
- Who is Who
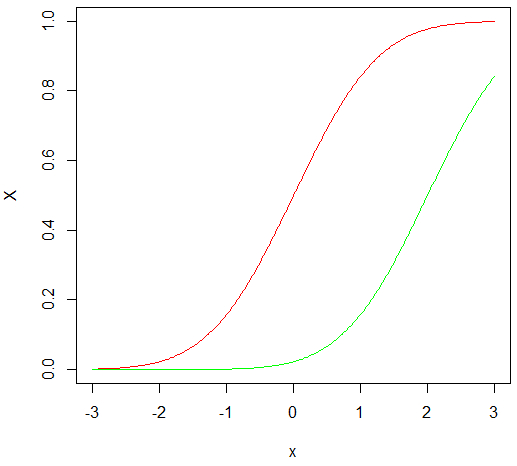
How to create two line charts in the same plot in R?
We can do this by using lines function after plotting the first chart.
Example
> x <- seq(-3, 3, 0.025)
> X1 <- pnorm(x)
> X2 <- pnorm(x, 2, 1)
> plot(x, X1, type="l",col="red", ylab="X")
> lines(x, X2, col="green")

Updated on: 2020-07-06T12:45:16+05:30
200 Views

Advertisements