
- Trending Categories
 Data Structure
 Networking
 RDBMS
RDBMS Operating System
 Java
Java MS Excel
 iOS
iOS HTML
HTML CSS
CSS Android
 Python
 C Programming
 C++
C++ C#
C# MongoDB
 MySQL
MySQL Javascript
 PHP
PHP Physics
 Chemistry
 Biology
 Mathematics
 English
 Economics
 Psychology
 Social Studies
 Fashion Studies
 Legal Studies
- Selected Reading
- UPSC IAS Exams Notes
- Developer's Best Practices
- Questions and Answers
- Effective Resume Writing
- HR Interview Questions
- Computer Glossary
- Who is Who
How to create vertical line in xyplot in R?
To create vertical line in xyplot, we can use abline function.
For Example, if we have a data frame called df that contains two columns say X and Y and we want to create a scatterplot between X and Y using xyplot with a vertical line at X = 2 then we can use the below command −
xyplot(y~x,df,abline=c(v=2))
Example
Consider the data frame given below −
x<-rnorm(20)
y<-rnorm(20)
df<-data.frame(x,y)
df
The following dataframe is created
             x          y
1  -1.16650463  1.72807759
2  -0.74691131  0.98477997
3   1.20673873 -1.22473788
4  -1.68721988  0.70972622
5   0.41970989 -0.10921999
6   0.23349876  1.78260790
7   3.19590120 -0.24344468
8  -2.72968034 -1.52710702
9  -0.84079580  0.49183437
10  0.67402867  0.35450366
11  1.67432651 -0.01762635
12  0.83968708 -1.05655032
13 -1.42836844 -0.83891467
14  2.23938817 -0.01262572
15 -1.75726622  1.03811015
16 -1.11301609 -0.36445771
17 -0.04314039 -0.87144947
18  2.22558691 -2.70420303
19  0.50631659 0.49424984
20  0.73039605 0.42734032
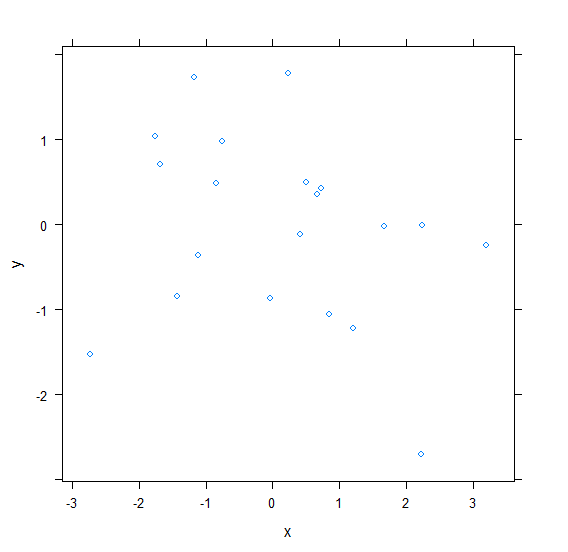
To load the lattice package and create a scatterplot between x and y on the above created data frame, add the following code to the above snippet −
x<-rnorm(20)
y<-rnorm(20)
df<-data.frame(x,y)
library(lattice)
xyplot(y~x,df)
Output
If you execute all the above given snippets as a single program, it generates the following Output −
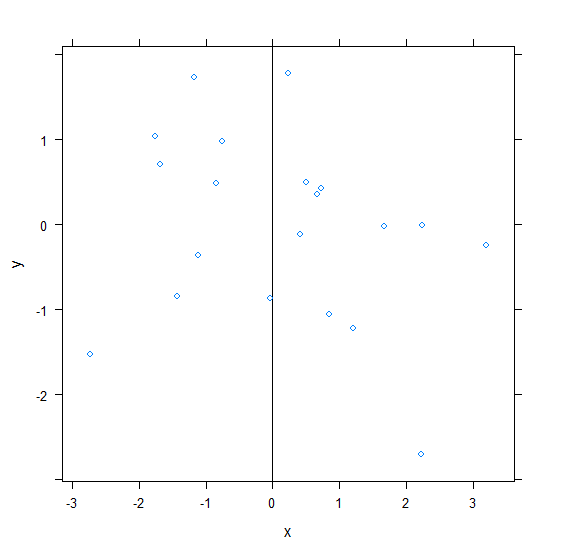
To create a scatterplot between x and y with vertical line X = 0 on the above created data frame, add the following code to the above snippet −
x<-rnorm(20)
y<-rnorm(20)
df<-data.frame(x,y)
library(lattice)
xyplot(y~x,df,abline=c(v=0))
Output
If you execute all the above given snippets as a single program, it generates the following Output −

520 Views
