
- Trending Categories
 Data Structure
 Networking
 RDBMS
RDBMS Operating System
 Java
Java MS Excel
 iOS
iOS HTML
HTML CSS
CSS Android
 Python
 C Programming
 C++
C++ C#
C# MongoDB
 MySQL
MySQL Javascript
 PHP
PHP Physics
 Chemistry
 Biology
 Mathematics
 English
 Economics
 Psychology
 Social Studies
 Fashion Studies
 Legal Studies
- Selected Reading
- UPSC IAS Exams Notes
- Developer's Best Practices
- Questions and Answers
- Effective Resume Writing
- HR Interview Questions
- Computer Glossary
- Who is Who
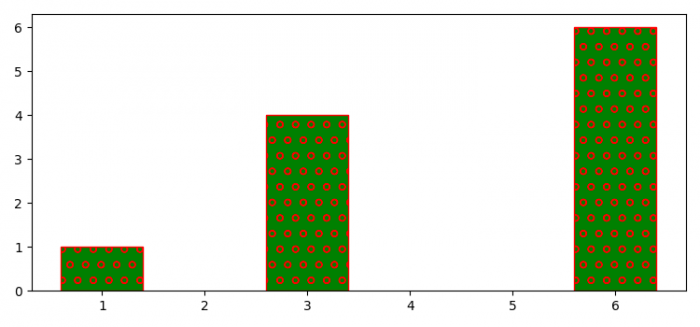
How to decrease the hatch density in Matplotlib?
To decrease the hatch density in Matplotlib, we can take the following steps −
Set the figure size and adjust the padding between and around the subplots.
Make a customized horizontal hatch class to override the density.
Append the horizontal hatch class.
Create a new figure or activate an existing figure.
Add an 'ax1' to the figure as part of a subplot arrangement.
Make lists of data points.
Make a bar plot with x and ydata points, with hatch='o', color='green' and edgecolor='red'.
To display the figure, use show() method.
Example
from matplotlib import pyplot as plt, hatch

plt.rcParams["figure.figsize"] = [7.50, 3.50]
plt.rcParams["figure.autolayout"] = True

class MyHorizontalHatch(hatch.HorizontalHatch):
   def __init__(self, hatch, density):
      char_count = hatch.count('o')
      if char_count > 0:
         self.num_lines = int((1.0 / char_count) * density)
      else:
         self.num_lines = 0
      self.num_vertices = self.num_lines * 2
      super().__init__(hatch, density)

hatch._hatch_types.append(MyHorizontalHatch)

fig = plt.figure()

ax1 = fig.add_subplot(111)

x = [3, 6, 1]
y = [4, 6, 1]

ax1.bar(x, y, color='green', edgecolor='red', hatch="o", lw=1., zorder=0)

plt.show()
Output

Updated on: 2021-09-23T10:33:17+05:30
793 Views

Advertisements