
- Trending Categories
 Data Structure
 Networking
 RDBMS
RDBMS Operating System
 Java
Java MS Excel
 iOS
iOS HTML
HTML CSS
CSS Android
 Python
 C Programming
 C++
C++ C#
C# MongoDB
 MySQL
MySQL Javascript
 PHP
PHP Physics
 Chemistry
 Biology
 Mathematics
 English
 Economics
 Psychology
 Social Studies
 Fashion Studies
 Legal Studies
- Selected Reading
- UPSC IAS Exams Notes
- Developer's Best Practices
- Questions and Answers
- Effective Resume Writing
- HR Interview Questions
- Computer Glossary
- Who is Who
How to display mean in a boxplot with cross sign in base R?
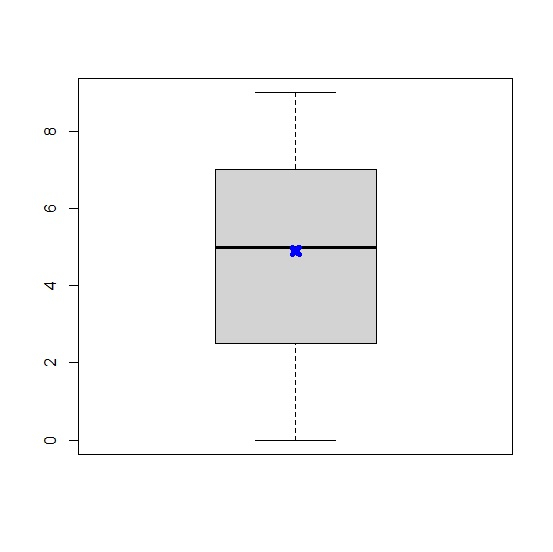
To display mean in a boxplot with cross sign in base R, we can use the points function and pass the mean with pch = 4 that represents a star, also we can change the color to highlight the mean using col argument and the size of the start can be changed using lwd argument as shown in the below examples.
Example
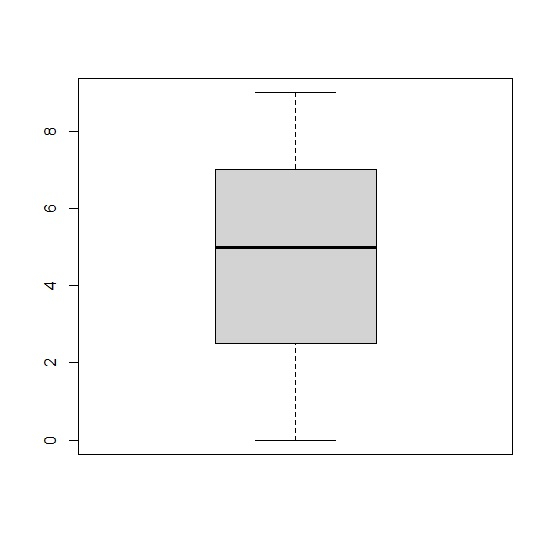
x<-sample(0:9,100,replace=TRUE)
boxplot(x)
Output
Example
points(mean(x),col="blue",pch=4,lwd=6)
Output

Updated on: 2021-03-16T11:14:20+05:30
338 Views

Advertisements