
- Trending Categories
 Data Structure
 Networking
 RDBMS
RDBMS Operating System
 Java
Java MS Excel
 iOS
iOS HTML
HTML CSS
CSS Android
 Python
 C Programming
 C++
C++ C#
C# MongoDB
 MySQL
MySQL Javascript
 PHP
PHP Physics
 Chemistry
 Biology
 Mathematics
 English
 Economics
 Psychology
 Social Studies
 Fashion Studies
 Legal Studies
- Selected Reading
- UPSC IAS Exams Notes
- Developer's Best Practices
- Questions and Answers
- Effective Resume Writing
- HR Interview Questions
- Computer Glossary
- Who is Who
How to remove the plot margin in base R between the axes and the points inside the plot?
To remove the plot margin in base R between the axes and the points inside the plot, we can use xaxs and yaxs argument in plot function. Depending on the choices of the arguments xaxs and yaxs, the plot region in the respective direction is 4% larger than specified by these limits or exactly matches the "i" limits.
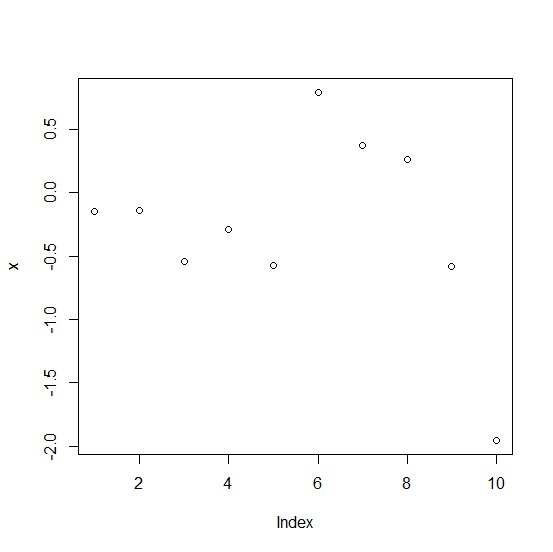
Example
x<-rnorm(10)
plot(x)
Output
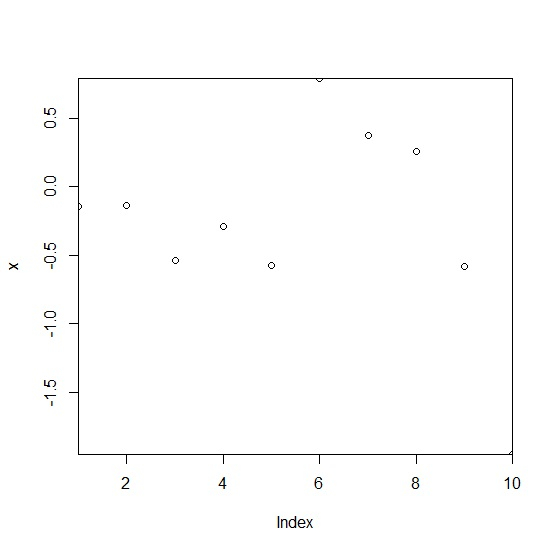
Example
plot(x,xaxs="i",yaxs="i")
Output

Updated on: 2021-02-08T05:40:39+05:30
1K+ Views

Advertisements