
- Trending Categories
 Data Structure
 Networking
 RDBMS
RDBMS Operating System
 Java
Java MS Excel
 iOS
iOS HTML
HTML CSS
CSS Android
 Python
 C Programming
 C++
C++ C#
C# MongoDB
 MySQL
MySQL Javascript
 PHP
PHP Physics
 Chemistry
 Biology
 Mathematics
 English
 Economics
 Psychology
 Social Studies
 Fashion Studies
 Legal Studies
- Selected Reading
- UPSC IAS Exams Notes
- Developer's Best Practices
- Questions and Answers
- Effective Resume Writing
- HR Interview Questions
- Computer Glossary
- Who is Who
How to set the line color in Python Plotly?
Python Plotly has features that you can use to set the line color in a graph. In this tutorial, let us understand how to set the line color in Plotly.
Here, we will use plotly.express to generate the figures. It contains a lot of methods to customize the charts and render a chart in HTML format.
To set the line color, we will use the update_traces() method and set line_color with color values.
Follow the steps given below to set the line color.
Step 1
Import plotly.express module and alias as px.
import plotly.express as px
Step 2
Create a dataframe as shown below ?
import pandas as pd
data = {'mark':[12,13,11,14,15], 'avg':[5,6,5,7,8]}
df = pd.DataFrame(data)
Step 3
Create a line plot with the following coordinates ?
fig = px.line(df, df['mark'], df['avg'])
Step 4
Use the update_traces() method to set line color as "purple". Similarly, you can assign other different colors as well.
fig.update_traces(line_color='purple')
Example
Here is the complete code to set the line color in Python Plotly ?
import plotly.express as px
import pandas as pd

data = {'mark':[12,13,11,14,15], 'avg':[5,6,5,7,8]}
df = pd.DataFrame(data)

fig = px.line(df, df['mark'], df['avg'])
fig = px.scatter(width=716, height=400)
fig.update_traces(line_color='purple')

fig.show()
Output
It will show the following output on the browser ?
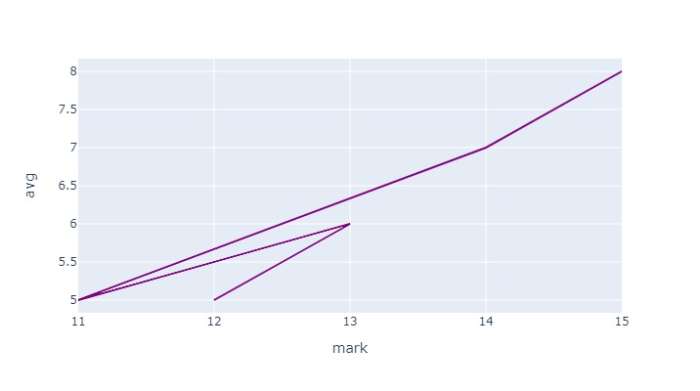
Observe that here we have used the line_color attribute of the update_traces() method to set the line color as "purple". You can choose other colors too and also, you can use the line_width attribute to set the width of a line on the graph.

17K+ Views
