
- Trending Categories
 Data Structure
 Networking
 RDBMS
RDBMS Operating System
 Java
Java MS Excel
 iOS
iOS HTML
HTML CSS
CSS Android
 Python
 C Programming
 C++
C++ C#
C# MongoDB
 MySQL
MySQL Javascript
 PHP
PHP Physics
 Chemistry
 Biology
 Mathematics
 English
 Economics
 Psychology
 Social Studies
 Fashion Studies
 Legal Studies
- Selected Reading
- UPSC IAS Exams Notes
- Developer's Best Practices
- Questions and Answers
- Effective Resume Writing
- HR Interview Questions
- Computer Glossary
- Who is Who
How to set the range for boxplot in base R?
By default, R considers the vector or the data frame column values. But if we want to set the range for boxplot in base R, we can use ylim argument within the boxplot function. For example, if we have a vector called x that contains values starting from 21 to 50 and we want to have the range in the boxplot starting from 1 to 100 then we can use the command
boxplot(x,ylim=c(1,100))
Example
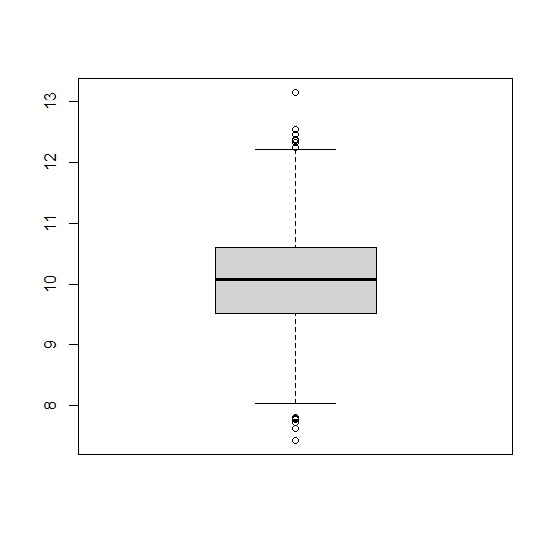
x<-rnorm(500,10,1)
boxplot(x)
Output
Example
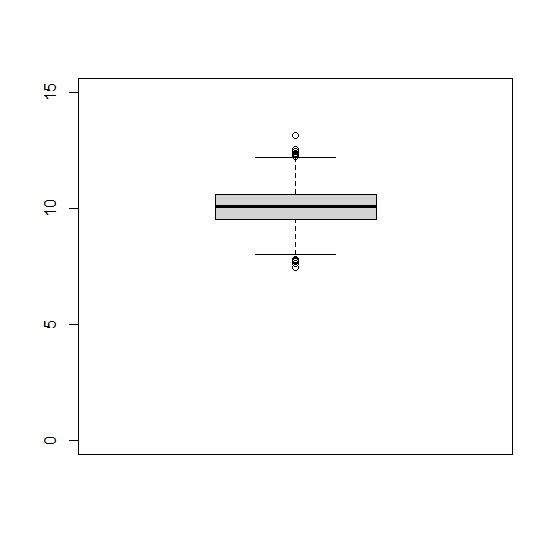
boxplot(x,ylim=c(0,15))
Output
Example
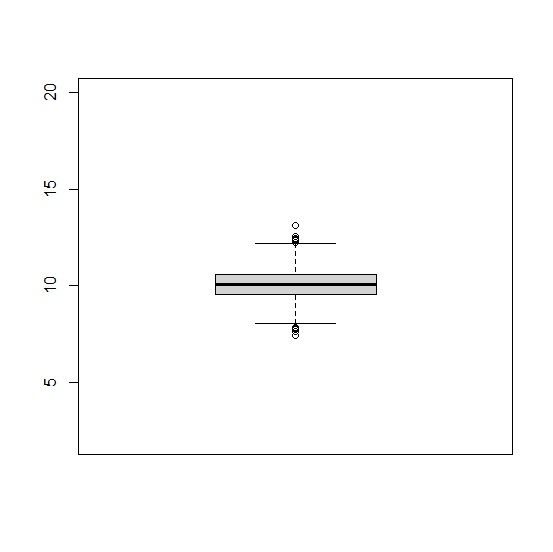
boxplot(x,ylim=c(2,20))
Output

Updated on: 2021-03-17T06:46:24+05:30
2K+ Views

Advertisements