
- Trending Categories
 Data Structure
 Networking
 RDBMS
RDBMS Operating System
 Java
Java MS Excel
 iOS
iOS HTML
HTML CSS
CSS Android
 Python
 C Programming
 C++
C++ C#
C# MongoDB
 MySQL
MySQL Javascript
 PHP
PHP Physics
 Chemistry
 Biology
 Mathematics
 English
 Economics
 Psychology
 Social Studies
 Fashion Studies
 Legal Studies
- Selected Reading
- UPSC IAS Exams Notes
- Developer's Best Practices
- Questions and Answers
- Effective Resume Writing
- HR Interview Questions
- Computer Glossary
- Who is Who
How to set the xticklabels for date in matplotlib?
To set the xticklabels for date in matplotlib, we can take the following steps −
Steps
Set the figure size and adjust the padding between and around the subplots.
Create two lists of epochs and values.
Get a list of dates from epochs.
Create a figure and a set of subplots.
Plot the date and values using plot() method.
Set the xticklabels, get date formatter and set the major formatter.
To remove the overlapping for ticklabels, rotate it by 10.
To display the figure, use show() method.
Example
import matplotlib.pyplot as plt
import matplotlib.dates as mdates
import time

plt.rcParams["figure.figsize"] = [7.50, 3.50]
plt.rcParams["figure.autolayout"] = True

epochs = [1259969793926, 1259969793927, 1259969793929, 1259969793928, 1259969793939]
values = [-0.5, -0.5, -0.75, -0.5, -1.25]

dates = [time.strftime('%Y-%m-%d %H:%M:%S', time.localtime(date)) for date in epochs]

fig, axes = plt.subplots(1, 1)
line1, = axes.plot(dates, values, lw=2, marker='*', color='r')

axes.set_xticklabels(dates)
fmt = mdates.DateFormatter('%Y-%m-%d %H:%M:%S')

axes.xaxis.set_major_formatter(fmt)
axes.tick_params(rotation=10)

plt.show()
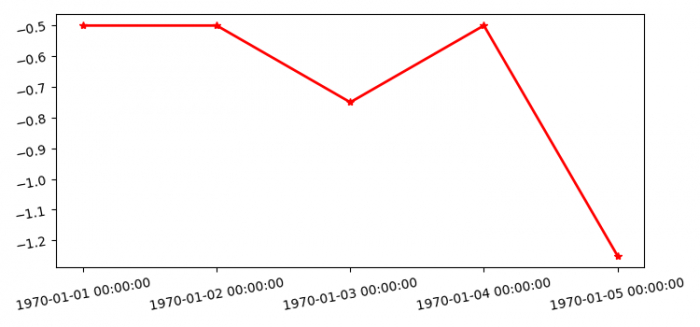
Output
It will produce the following output −

Updated on: 2022-02-02T10:51:20+05:30
3K+ Views

Advertisements