
- Trending Categories
 Data Structure
 Networking
 RDBMS
RDBMS Operating System
 Java
Java MS Excel
 iOS
iOS HTML
HTML CSS
CSS Android
 Python
 C Programming
 C++
C++ C#
C# MongoDB
 MySQL
MySQL Javascript
 PHP
PHP Physics
 Chemistry
 Biology
 Mathematics
 English
 Economics
 Psychology
 Social Studies
 Fashion Studies
 Legal Studies
- Selected Reading
- UPSC IAS Exams Notes
- Developer's Best Practices
- Questions and Answers
- Effective Resume Writing
- HR Interview Questions
- Computer Glossary
- Who is Who
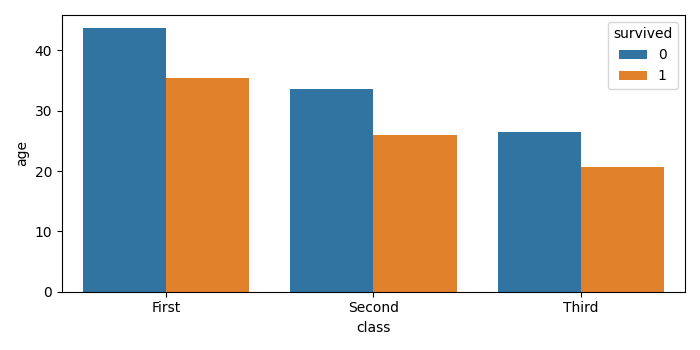
How to turn off error bars in Seaborn Bar Plot using Matplotlib?
To turn off error bars in a Seaborn bar plot, we can take the following steps−
- Load an example dataset from the online repository (requires Internet).
- Show the point estimates and confidence intervals with bars.
- To display the figure, use show() method.
Example
import seaborn as sns
import matplotlib.pyplot as plt
plt.rcParams["figure.figsize"] = [7.00, 3.50]
plt.rcParams["figure.autolayout"] = True
df = sns.load_dataset('titanic')
sns.barplot(x='class', y='age', hue='survived', data=df, ci=None)
plt.show()
Output

Updated on: 2021-05-15T12:29:29+05:30
879 Views

Advertisements