
- Trending Categories
 Data Structure
 Networking
 RDBMS
RDBMS Operating System
 Java
Java MS Excel
 iOS
iOS HTML
HTML CSS
CSS Android
 Python
 C Programming
 C++
C++ C#
C# MongoDB
 MySQL
MySQL Javascript
 PHP
PHP Physics
 Chemistry
 Biology
 Mathematics
 English
 Economics
 Psychology
 Social Studies
 Fashion Studies
 Legal Studies
- Selected Reading
- UPSC IAS Exams Notes
- Developer's Best Practices
- Questions and Answers
- Effective Resume Writing
- HR Interview Questions
- Computer Glossary
- Who is Who
How to view all colormaps available in Matplotlib?
To view all colormaps available in Matplotlib, we can take the following steps −
- Set the figure size and adjust the padding between and around the subplots.
- Create a new figure or activate an existing figure.
- Add an '~.axes.Axes' to the figure as part of a subplot arrangement
- Make an axis that is divider on the existing axes.
- Create random data using numpy.
- Display the data as an image, i.e., on a 2D regular raster.
- Create a colorbar for a ScalarMappable instance, im.
- Set a title for the current figure.
- Animate the image with all colormaps available in matplotlib.
- Make an animation by repeatedly calling a function.
- To display the figure, use show() method.
Example
import numpy as np
import matplotlib.pyplot as plt
import matplotlib.animation as animation
from mpl_toolkits.axes_grid1 import make_axes_locatable

plt.rcParams["figure.figsize"] = [7.50, 3.50]
plt.rcParams["figure.autolayout"] = True

fig = plt.figure()
ax = fig.add_subplot(111)
div = make_axes_locatable(ax)
cax = div.append_axes('right', '5%', '5%')
data = np.random.rand(5, 5)
im = ax.imshow(data)
cb = fig.colorbar(im, cax=cax)
cmap = plt.colormaps()
tx = ax.set_title('Color map: {0}'.format(cmap[0]))

def animate(i):
   cax.cla()
   data = np.random.rand(5, 5)
   im = ax.imshow(data, cmap=cmap[i])
   fig.colorbar(im, cax=cax)
   tx.set_text('Color map: {0}'.format(cmap[i]))

ani = animation.FuncAnimation(fig, animate, frames=166)

plt.show()
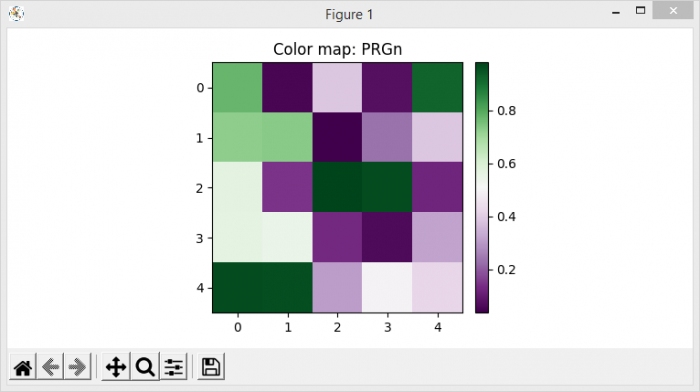
Output

Updated on: 2021-06-15T12:06:49+05:30
177 Views

Advertisements