
- Trending Categories
 Data Structure
 Networking
 RDBMS
RDBMS Operating System
 Java
Java MS Excel
 iOS
iOS HTML
HTML CSS
CSS Android
 Python
 C Programming
 C++
C++ C#
C# MongoDB
 MySQL
MySQL Javascript
 PHP
PHP Physics
 Chemistry
 Biology
 Mathematics
 English
 Economics
 Psychology
 Social Studies
 Fashion Studies
 Legal Studies
- Selected Reading
- UPSC IAS Exams Notes
- Developer's Best Practices
- Questions and Answers
- Effective Resume Writing
- HR Interview Questions
- Computer Glossary
- Who is Who
How to write text outside plot using ggplot2 in R?
To write text outside plot using ggplot2, we can use annotate function and coord_cartesian function. The annotate function will define the text value and the coord_cartesian function will define the position of the text outside the plot area.
Check out the below example to understand how it works.
Example
Following snippet creates a sample data frame −
x<-rnorm(20)
y<-rnorm(20)
df<-data.frame(x,y)
df
The following dataframe is created −
        x             y
1  -0.40472483  -0.07760919
2  -0.09077911   0.40705712
3   0.04122442  -0.67552070
4  -0.78520861  -0.24918263
5  -1.38592400   0.67534026
6  -0.68027757   1.06726703
7  -0.73141825  -0.01776461
8   0.09336187   0.27947009
9   0.38625538  -0.34174606
10 -0.18627279   1.00174991
11 -1.68310315  -0.29876124
12  1.33719646  -0.13991965
13 -0.70679075  -0.11464434
14 -1.54770217   2.61299815
15  1.55050758   0.82286414
16  0.30323709   0.58833182
17  0.36705970  -2.12925379
18  0.77242047  -1.54357138
19  1.13557728   0.04046488
20 -0.09440322  -0.94294441
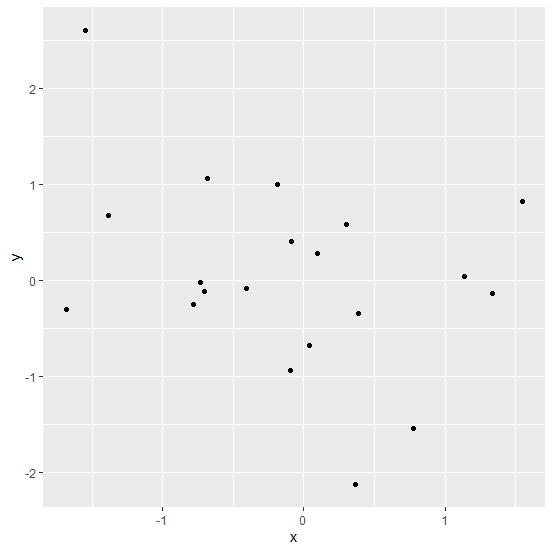
To load ggplot2 package and create point chart between x and y, add the following code to the above snippet −
library(ggplot2)
ggplot(df,aes(x,y))+geom_point()
Output
If you execute all the above given snippets as a single program, it generates the following output −
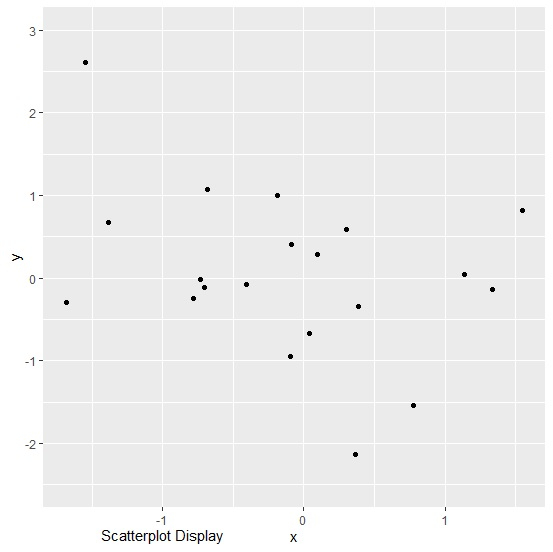
To create point chart between x and y with text outside the plot, add the following code to the above snippet −
ggplot(df,aes(x,y))+geom_point()+annotate("text",x=-1,y=-3.1,label="Scatterplot Display")+coord_cartesian(ylim=c(-2.5,3),clip="off")
Output
If you execute all the above given snippets as a single program, it generates the following output −

11K+ Views
