
- Trending Categories
 Data Structure
 Networking
 RDBMS
RDBMS Operating System
 Java
Java MS Excel
 iOS
iOS HTML
HTML CSS
CSS Android
 Python
 C Programming
 C++
C++ C#
C# MongoDB
 MySQL
MySQL Javascript
 PHP
PHP Physics
 Chemistry
 Biology
 Mathematics
 English
 Economics
 Psychology
 Social Studies
 Fashion Studies
 Legal Studies
- Selected Reading
- UPSC IAS Exams Notes
- Developer's Best Practices
- Questions and Answers
- Effective Resume Writing
- HR Interview Questions
- Computer Glossary
- Who is Who
Is it possible to plot implicit equations using Matplotlib?
Matplotlib does not support the functionality to plot implicit equations, however, you can try a code like the one we have shown here.
Steps
- Create xrange and yrange data points using numpy.
- Return coordinate matrices from coordinate vectors using meshgrid() method.
- Create an equation from x and y.
- Create a 3D contour using contour() method with x, y and the equation.
- To display the figure, use show() method.
Example
from matplotlib import pyplot as plt
import numpy as np
plt.rcParams["figure.figsize"] = [7.50, 3.50]
plt.rcParams["figure.autolayout"] = True
delta = 0.025
xrange = np.arange(-5.0, 20.0, delta)
yrange = np.arange(-5.0, 20.0, delta)
x, y = np.meshgrid(xrange, yrange)
equation = np.sin(x) - np.cos(y)**2
plt.contour(x, y, equation, [0])
plt.show()
Output
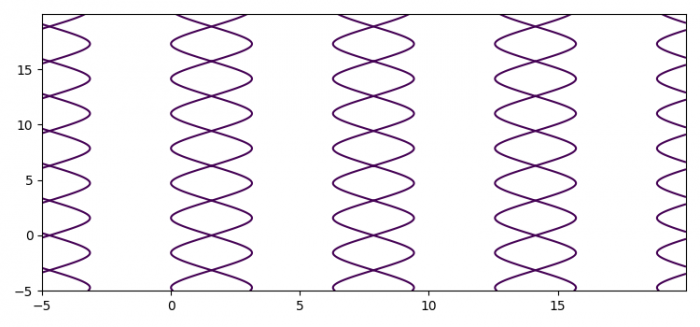
You can use a tool like scipy.optimize to plot implicit equations in Matplotlib.

Updated on: 2021-05-15T12:35:16+05:30
3K+ Views

Advertisements