
- Trending Categories
 Data Structure
 Networking
 RDBMS
RDBMS Operating System
 Java
Java MS Excel
 iOS
iOS HTML
HTML CSS
CSS Android
 Python
 C Programming
 C++
C++ C#
C# MongoDB
 MySQL
MySQL Javascript
 PHP
PHP Physics
 Chemistry
 Biology
 Mathematics
 English
 Economics
 Psychology
 Social Studies
 Fashion Studies
 Legal Studies
- Selected Reading
- UPSC IAS Exams Notes
- Developer's Best Practices
- Questions and Answers
- Effective Resume Writing
- HR Interview Questions
- Computer Glossary
- Who is Who
Matplotlib log scale tick label number formatting
To set the log scale tick label number on the axes, we can take the following steps −
Set x and y axis limits (1 to 100), using ylim and xlim, on both the axes.
Using loglog() method, make a plot with log scaling on both the x and y axis.
To display the figure, use the plot() method.
Example
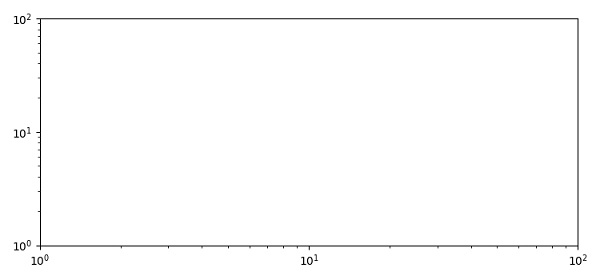
from matplotlib import pyplot as plt
plt.rcParams["figure.figsize"] = [7.50, 3.50]
plt.rcParams["figure.autolayout"] = True
plt.ylim(1, 100)
plt.xlim(1, 100)
plt.loglog()
plt.show()
Output

Updated on: 2021-04-09T12:32:04+05:30
764 Views

Advertisements