
- Trending Categories
 Data Structure
 Networking
 RDBMS
RDBMS Operating System
 Java
Java MS Excel
 iOS
iOS HTML
HTML CSS
CSS Android
 Python
 C Programming
 C++
C++ C#
C# MongoDB
 MySQL
MySQL Javascript
 PHP
PHP Physics
 Chemistry
 Biology
 Mathematics
 English
 Economics
 Psychology
 Social Studies
 Fashion Studies
 Legal Studies
- Selected Reading
- UPSC IAS Exams Notes
- Developer's Best Practices
- Questions and Answers
- Effective Resume Writing
- HR Interview Questions
- Computer Glossary
- Who is Who
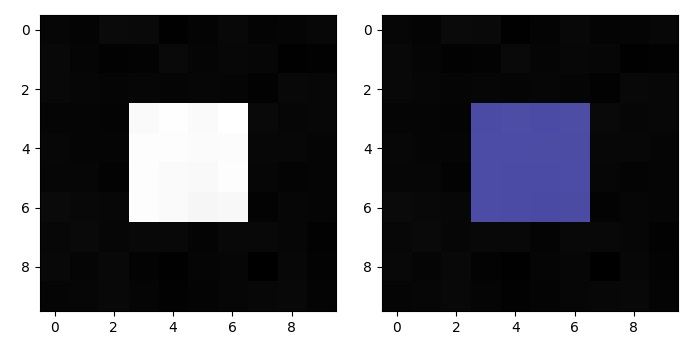
Overlay an image segmentation with Numpy and Matplotlib
To overlay an image segmentation with numpy, we can take the following Steps −
Make a masked array of 10×10 dimension.
Update the masked array with 1 for some region.
Make image data using numpy.
Mask an array where a condition is met, to get the masked data.
Create a new figure or activate an existing figure using figure() mrthod.
Use imshow() method to display data as an image, i.e., on a 2D regular raster.
To display the figure, use show() method.
Example
from matplotlib import pyplot as plt
import numpy as np
plt.rcParams["figure.figsize"] = [7.00, 3.50]
plt.rcParams["figure.autolayout"] = True
mask = np.zeros((10, 10))
mask[3:-3, 3:-3] = 1
im = mask + np.random.randn(10, 10) * 0.01
masked = np.ma.masked_where(mask == 0, mask)
plt.figure()
plt.subplot(1, 2, 1)
plt.imshow(im, 'gray', interpolation='none')
plt.subplot(1, 2, 2)
plt.imshow(im, 'gray', interpolation='none')
plt.imshow(masked, 'jet', interpolation='none', alpha=0.7)
plt.show()
Output

Updated on: 2021-05-15T12:12:02+05:30
3K+ Views

Advertisements