
- Trending Categories
 Data Structure
 Networking
 RDBMS
RDBMS Operating System
 Java
Java MS Excel
 iOS
iOS HTML
HTML CSS
CSS Android
 Python
 C Programming
 C++
C++ C#
C# MongoDB
 MySQL
MySQL Javascript
 PHP
PHP Physics
 Chemistry
 Biology
 Mathematics
 English
 Economics
 Psychology
 Social Studies
 Fashion Studies
 Legal Studies
- Selected Reading
- UPSC IAS Exams Notes
- Developer's Best Practices
- Questions and Answers
- Effective Resume Writing
- HR Interview Questions
- Computer Glossary
- Who is Who
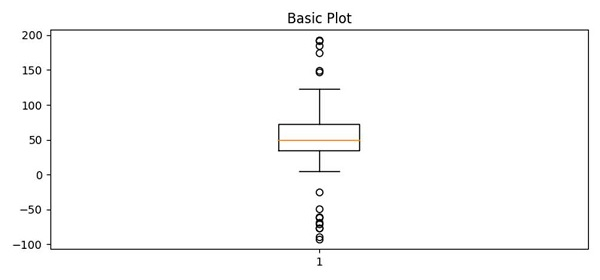
Pythonic way of detecting outliers in one dimensional observation data using Matplotlib
To detect outliers in one dimensional observation data, we can take the following Steps −
Create spread, center, flier_high and flier_low.
Using the above data (Step 1), we can calculate data.
Use the suplots() method to create a figure and a set of subplots, i.e., fig1 and ax1.
Set the title of ax1.
Now using the boxplot() method and data, make a box and a whisker plot. Beyond the whiskers, data are considered outliers and are plotted as individual points.
To display the figure, use the show() method.
Example
from matplotlib import pyplot as plt
import numpy as np
plt.rcParams["figure.figsize"] = [7.50, 3.50]
plt.rcParams["figure.autolayout"] = True
np.random.seed(19680801)
spread = np.random.rand(50) * 100
center = np.ones(25) * 50
flier_high = np.random.rand(10) * 100 + 100
flier_low = np.random.rand(10) * -100
data = np.concatenate((spread, center, flier_high, flier_low))
fig1, ax1 = plt.subplots()
ax1.set_title('Basic Plot')
ax1.boxplot(data)
plt.show()
Output

Updated on: 2021-04-09T08:19:37+05:30
200 Views

Advertisements