
- Trending Categories
 Data Structure
 Networking
 RDBMS
RDBMS Operating System
 Java
Java MS Excel
 iOS
iOS HTML
HTML CSS
CSS Android
 Python
 C Programming
 C++
C++ C#
C# MongoDB
 MySQL
MySQL Javascript
 PHP
PHP Physics
 Chemistry
 Biology
 Mathematics
 English
 Economics
 Psychology
 Social Studies
 Fashion Studies
 Legal Studies
- Selected Reading
- UPSC IAS Exams Notes
- Developer's Best Practices
- Questions and Answers
- Effective Resume Writing
- HR Interview Questions
- Computer Glossary
- Who is Who
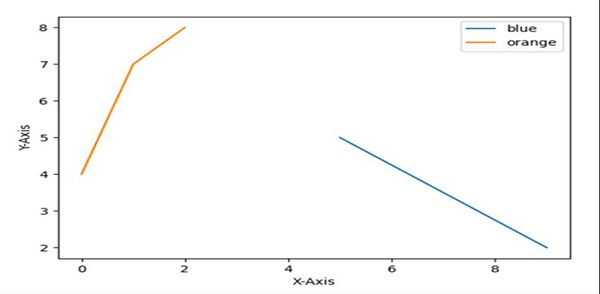
Show only certain items in legend Python Matplotlib
Using plt.legend(), we can add or show certain items just by putting the values in the list.
Steps
Set the X-axis label using plt.xlabel() method.
Set the Y-axis label using plt.ylabel() method.
Plot the lines using the lists that are passed in the plot() method argument.
Location and legend_drawn flags can help to find a location and make the flag True for border.
Set the legend with “blue” and “orange” elements.
To show the figure use plt.show() method.
Example
import matplotlib.pyplot as plt

plt.ylabel("Y-axis ")
plt.xlabel("X-axis ")

plt.plot([9, 5], [2, 5], [4, 7, 8])

location = 0 # For the best location
legend_drawn_flag = True
plt.legend(["blue", "orange"], loc=0, frameon=legend_drawn_flag)

plt.show()
Output

Updated on: 2021-03-17T07:51:23+05:30
2K+ Views

Advertisements