
- Trending Categories
 Data Structure
 Networking
 RDBMS
RDBMS Operating System
 Java
Java MS Excel
 iOS
iOS HTML
HTML CSS
CSS Android
 Python
 C Programming
 C++
C++ C#
C# MongoDB
 MySQL
MySQL Javascript
 PHP
PHP Physics
 Chemistry
 Biology
 Mathematics
 English
 Economics
 Psychology
 Social Studies
 Fashion Studies
 Legal Studies
- Selected Reading
- UPSC IAS Exams Notes
- Developer's Best Practices
- Questions and Answers
- Effective Resume Writing
- HR Interview Questions
- Computer Glossary
- Who is Who
What is the correct way to replace matplotlib tick labels with computed values?
We can use ax.loglog(x, y) and set_major_formatter() methods to replace tick labels with computed values.
Steps
Set the figure size and adjust the padding between and around the subplots.
Create a figure and a set of subplots.
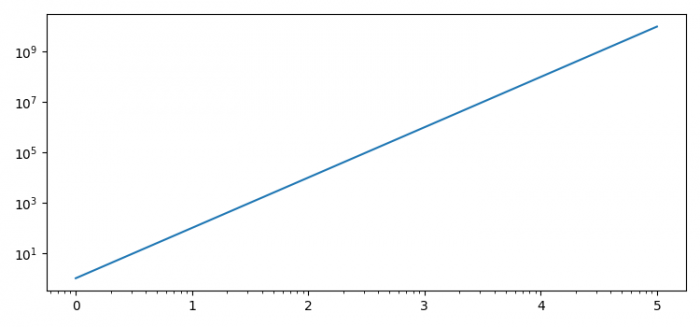
Make a plot with log scaling on both the X and Y axis.
Set the formatter of the major ticker.
To display the figure, use show() method.
Example
import numpy as np
from matplotlib import pyplot as plt, ticker

plt.rcParams["figure.figsize"] = [7.50, 3.50]
plt.rcParams["figure.autolayout"] = True

fig, ax = plt.subplots()

ax.loglog(np.logspace(0, 5), np.logspace(0, 5)**2)

ax.xaxis.set_major_formatter(ticker.LogFormatterExponent())

plt.show()
Output

Updated on: 2021-09-23T11:08:28+05:30
348 Views

Advertisements