
- Trending Categories
 Data Structure
 Networking
 RDBMS
RDBMS Operating System
 Java
Java MS Excel
 iOS
iOS HTML
HTML CSS
CSS Android
 Python
 C Programming
 C++
C++ C#
C# MongoDB
 MySQL
MySQL Javascript
 PHP
PHP Physics
 Chemistry
 Biology
 Mathematics
 English
 Economics
 Psychology
 Social Studies
 Fashion Studies
 Legal Studies
- Selected Reading
- UPSC IAS Exams Notes
- Developer's Best Practices
- Questions and Answers
- Effective Resume Writing
- HR Interview Questions
- Computer Glossary
- Who is Who
What is the difference between drawing plots using plot, axes or figure in matplotlib?
Let’s understand the difference between plot, axes, and figure with an example.
Plot − Plot helps to plot just one diagram with (x, y) coordinates.
Axes − Axes help to plot one or more diagrams in the same window and sets the location of the figure.
Figure − This method provides a top-level container for all the plot elements.
We can follow these steps to replicate the differences among them −
Create a new figure, or activate an existing figure, using plt.figure().
Add an axis to the figure as part of a subplot arrangement, using plt.add_subplot(xyz) where x is nrows, y is ncols and z is the index. Here taking x = 1(rows), y = 2(columns) and z = 1(position).
Draw the line bypassing the lists into the plt.plot() method.
To show the diagram, use the plt.show() method.
Example
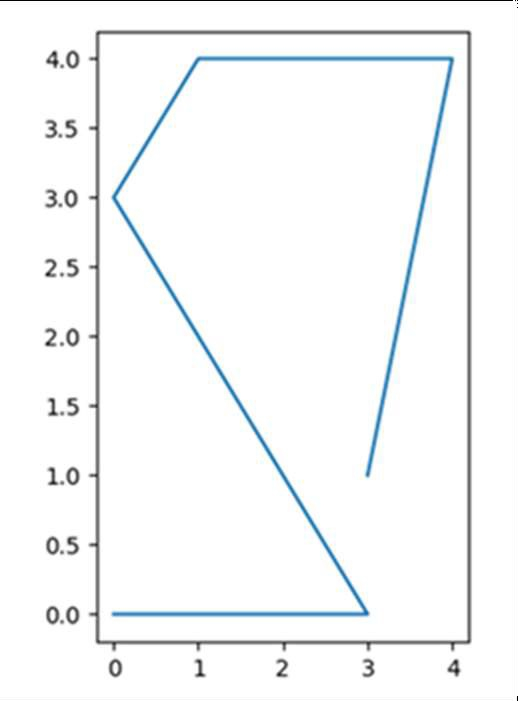
We will use plot, axes, and figure in the following code −
import matplotlib.pyplot as plt

fig = plt.figure()             # Activating figure

ax1 = fig.add_subplot(121)     # Setting up figure position

plt.plot([3, 4, 1, 0, 3, 0], [1, 4, 4, 3, 0, 0]) # Drawing lines in the
activated figure.

plt.show()
Output

3K+ Views
