
- Aptitude - Home
- Aptitude - Overview
- Quantitative Aptitude
Bar Charts - Online Quiz
Following quiz provides Multiple Choice Questions (MCQs) related to Bar Charts. You will have to read all the given answers and click over the correct answer. If you are not sure about the answer then you can check the answer using Show Answer button. You can use Next Quiz button to check new set of questions in the quiz.

Directions: Answer the questions given below using the graph below:
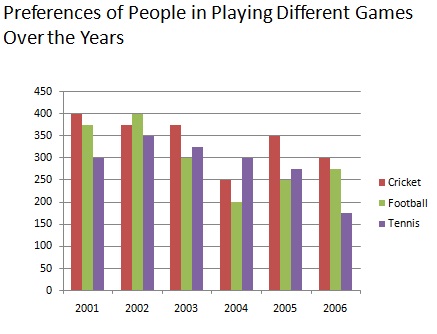
Q 1 - How many people preferred to play football(in millions) From 2001 to 2006?
Answer - D
Explanation
number of people who prefer who prefer to play football (from 2001 to 2006)
=(375+400+300+200+250+275) millions  = 1800 million.
Directions: Following bar diagrams depict the changes in student of a collage in four faculties from 2004- 05 to 2006-07. Study the diagram and answer the questions given below it:
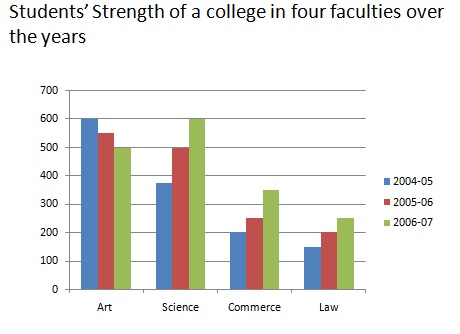
Q 2 - In which faculty student strength was decreasing regularly?
Answer - A
Explanation
clearly , there was regular decrease in student strength in Arts faculty.
Directions: Study the given bar graph carefully and answer the questions given below:
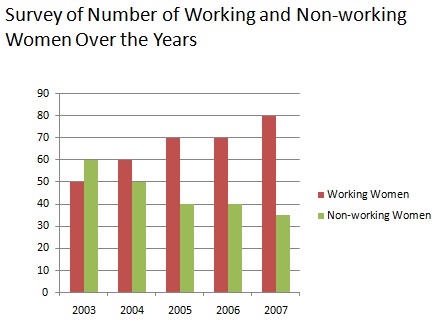
Q 3 - Which of the following is the correct ratio of the number of women working in the year 2003 to the number of women working in the year 2007?
Answer -D
Explanation
Required ratio = 50 millions :75 millions = 2:3
Directions: Study the given bar graph carefully and answer the questions given below:
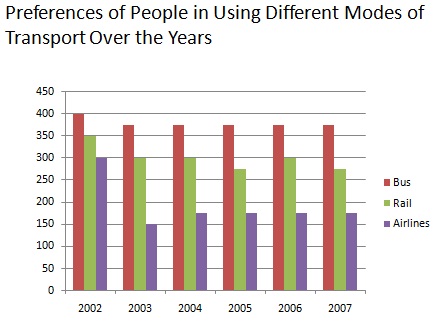
Q 4 - What is the respective ratio of the number of people who preferred to travel by bus to the number of people preferring to travel by rail in the year 2005?
Answer - A
Explanation
Required Ratio = 375:275 = 15:11
Directions: Given below is a multiple bar diagram depicting the changes in student of a collage in four faculties from 2004- 05 to 2006-07. Study the diagram and answer the questions given below it.:
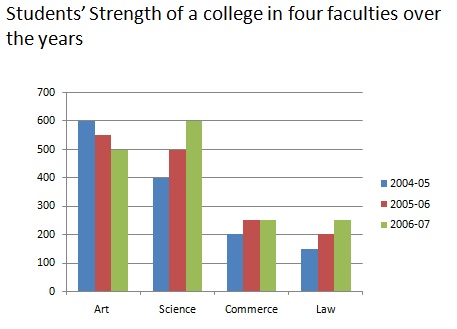
Q 5 - During which year , the strength of Arts faculty was mimimum?
Answer - C
Explanation
The strength inarts faulty in 2004-05, 2005-06 and 2006-07 was 550,600 and 500 respectively.
So, it was minimum in 2006-07.
Directions: The following bar diagram shows the monthly expenditure on food ,clothing, education ,fuel ,house rent and miscellaneous. Study the diagram and answer the questions given below it:
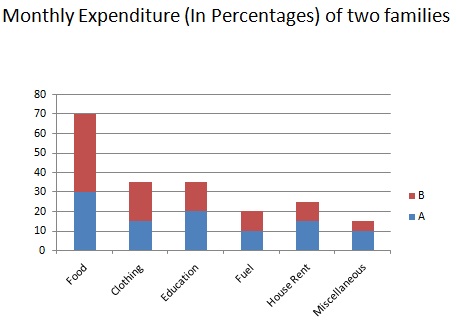
Q 6 - If total expenditure of both are equal then what percentage is B expenditure on food over A's expenditure on food?
Answer - D
Explanation
B's expenditure on food  = 40% of Rs. x= (40/100*x)= 2x/5
A's expenditure on food = 30% of RS. x = (30/100*x)=3x/10
B's expenses over A = (2x/5*10/3x*100)% = 400/3%
Directions: The following bar diagram given below shows the result of B.S.C students of a collage for three years. Study the bar diagram and answer the questions given below:
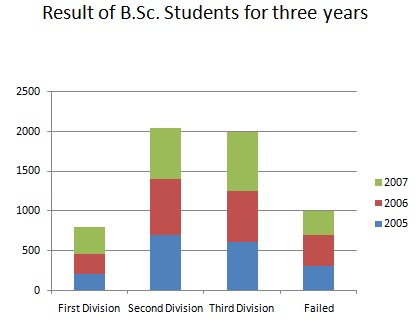
Q 7 - Which of the following is the number of third divisions in 2007?
Answer - B
Explanation
Number of 3rd divisions in 2007 = (1750-1000)= 750