
- Aptitude - Home
- Aptitude - Overview
- Quantitative Aptitude
Pie Charts - Online Quiz
Following quiz provides Multiple Choice Questions (MCQs) related to Pie Charts. You will have to read all the given answers and click over the correct answer. If you are not sure about the answer then you can check the answer using Show Answer button. You can use Next Quiz button to check new set of questions in the quiz.

Directions: Study the following pie-charts carefully and answer the question that follows.
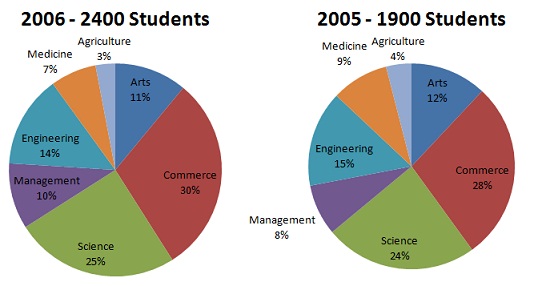
Q 1 - What is the percent expansion or reduction in number of understudy in science from years 2005 to 2006? (Adjusted off to closest number)
Answer - A
Explanation
Various understudy in science in 2005 = (24/100*1900) =456
Number of understudy in science in 2006= (25/100*2400) = 600
Percent expansion = (144/456*100) %= 32%
Directions: Study the Pie-charts carefully and answer the questions that follow:
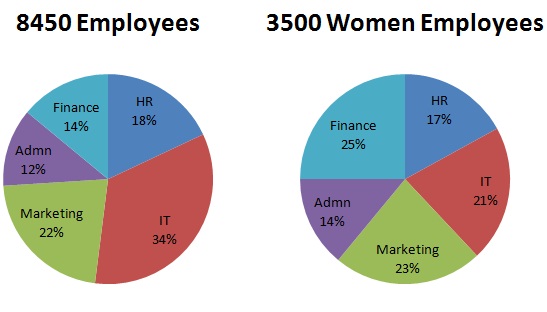
Q 2 - What is the particular proportion of number of ladies working in Administration division to the aggregate number of representatives working in that office?
Answer - B
Explanation
Administration Department
Aggregate no. of workers = (12/100*8450) = 1014
Number of ladies = (14/100*3500) = 490
Number of men = (1014-490) = 524

Required Ratio = 490: 1014 = 245: 507
Directions: The diagram given below depicts the sourced and uses of funds in a public Sector Enterprise. The total outlay is Rs. 4000 crore:
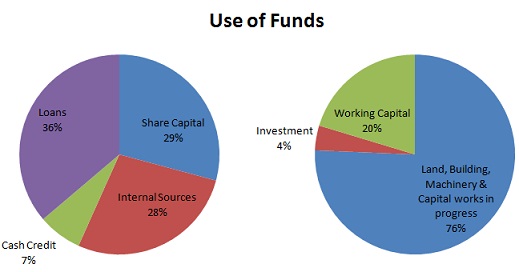
Q 3 - The organization needs all the more working capital. The amount of capital it can secure by reclaiming its venture?
Answer - C
Explanation
Capital obtained by recovering investment =4.1% of 4000 crore =Rs (4.1/100*4000) crores= Rs 164 crores.
Directions: Look at the pie-graphs given below and answer the question that follow:
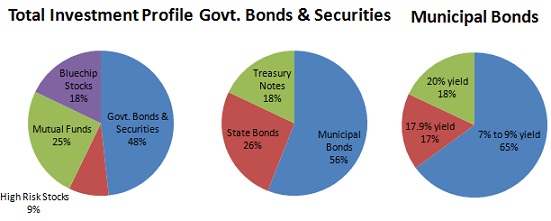
Q 4 - What amount of cash fitting in with the venture portfolio was interest in state bonds?
Answer - A
Explanation
Investment in state Bonds =Rs (26/100*110500000)=Rs 28730000.
Directions: Look at the Pie-Chart given below and answer the question that follow:
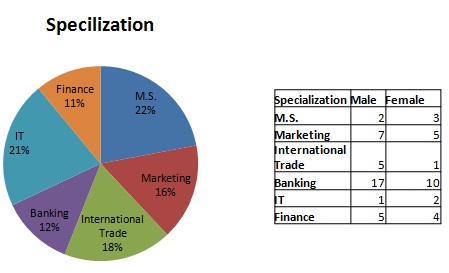
Q 5 - What is the rough rate of ladies contemplating Marketing of all understudies?
Answer - D
Explanation
No. Of ladies understudies in marketing= (16/100*4500*5/12) =300
Required % = (300/4500*100) % = 20/3= 7% about.
Directions: Study the Pie-Graph given below and answer the question that follows:
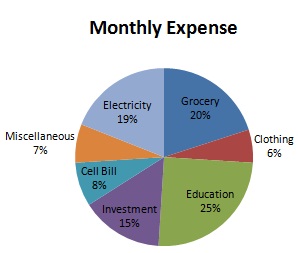
Q 6 - The family really paid Rs 4672 on Grocery. What is the distinction in the sums planned and spent on Grocery?
Answer - D
Explanation
According to budget, expenditure on grocery= (20/100*32000)= 6400 Rs.
Required difference = Rs. (6400-4672) = Rs. 1728
Directions: Study the Pie-Graph given below and answer the question that follows:
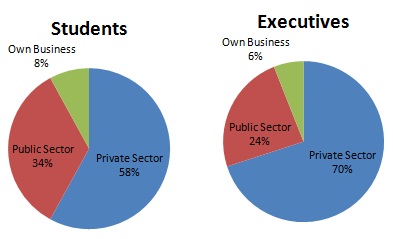
Q 7 - Which of the accompanying articulation is not genuine?
A - Reasonable decision among understudies is private division.
B - Clear decision among official is private part.
D - Higher rate of female Executive have picked private division than that of male officials.
Answer - C
Explanation
Percentage of female students opting for private sector= 55%
Percentage of male students opting for private sector= 60%
Thus, the statement (c) is not true.
Directions: Study the Pie-Graph given below and answer the question that follows:
Q 8 - Out of the6% Executive deciding on own business, the rate of females when contrasted with guys picking that, is
Answer - B
Explanation
It is clear from the bar graph that out of 6% executives opting for own business, the percentage of females as compared to male executive is less.
Directions: Study the Pie-Graph given below and answer the question that follows:
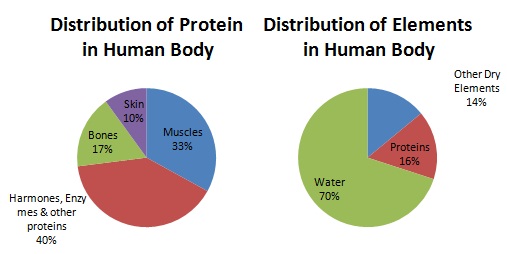
Q 9 - What some portion of the human body is made of neither bones nor skin?
Answer - A
Explanation
part of the body made of neither bones nor skin= 1-(1/3+1/10+1/6) =(1-18/30)=12/30 = 2/5
Directions: Study the Pie-Graph given below and answer the question that follows:
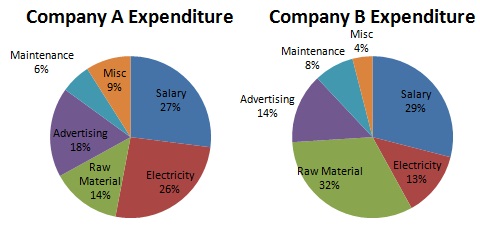
Q 10 - What is the proportion of sum spent by organization An on promoting and power individually?
Answer - B
Explanation
Ratio of amounts spent by A on advertising and electricity:
= (18% on Rs .3375000):  (26% on rs.35750000)
= 18/100*3375000: 26/100*33750000 = 18:26 = 9:13